Draw an ellipse on a graph and get the coordinates _Python
I’m working on Python 2.7. I have to define some regions of interest (AoI) on the picture. Basically, I’m trying to draw an ellipse (or more) on a specific part of the picture and get the coordinates of its outline (x; y)。 I want to save these coordinates in a file so I can use them later to see if my data is in the area.
Here is my code :
import matplotlib.pyplot as plt
import numpy as np
from matplotlib.patches import Ellipse, Circle
from matplotlib.path import Path

# Get an example image

img = imread('sposa.png')

# Create a figure. Equal aspect so circles look circular
fig,ax = plt.subplots(1)
ax.set_aspect('equal')

# Show the image
ax.imshow(img)
ax.set_xlim(0,1600)
ax.set_ylim(0,1200)
# Now, loop through coord arrays, and create a circle at each x,y pair
ellipse = Ellipse((1000, 400), width=400, height=100, edgecolor='white',facecolor='none',linewidth=2)

ax.add_patch(ellipse)
path = ellipse.get_path()

# Show the image
plt.show()
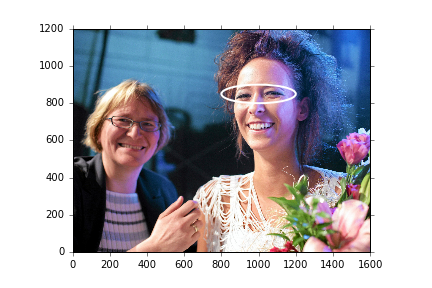
When I run the code, I get this (which is exactly what I wanted):
However, when I print the path to check it, I
get the following output, (I think) it is completely related to the ellipse.
Path(array([[ 0.        , -1.        ],
   [ 0.2652031 , -1.        ],
   [ 0.51957987, -0.89463369],
   [ 0.70710678, -0.70710678],
   [ 0.89463369, -0.51957987],
   [ 1.        , -0.2652031 ],
   [ 1.        ,  0.        ],
   [ 1.        ,  0.2652031 ],
   [ 0.89463369,  0.51957987],
   [ 0.70710678,  0.70710678],
   [ 0.51957987,  0.89463369],
   [ 0.2652031 ,  1.        ],
   [ 0.        ,  1.        ],
   [-0.2652031 ,  1.        ],
   [-0.51957987,  0.89463369],
   [-0.70710678,  0.70710678],
   [-0.89463369,  0.51957987],
   [-1.        ,  0.2652031 ],
   [-1.        ,  0.        ],
   [-1.        , -0.2652031 ],
   [-0.89463369, -0.51957987],
   [-0.70710678, -0.70710678],
   [-0.51957987, -0.89463369],
   [-0.2652031 , -1.        ],
   [ 0.        , -1.        ],
   [ 0.        , -1.        ]]), array([ 1,  4,  4,  4,  4,  4,  4,  4,  4,  4,  4,  4,  4,  4,  4,  4,  4,
    4,  4,  4,  4,  4,  4,  4,  4, 79], dtype=uint8))
However, I need a list of coordinates of the ellipse relative to the image pixels (1600 x 1200). I may be using the wrong function, or the image and ellipse do not match.
I deserve something like this (here’s an example of a previous experiment) :
[ Path(array([[ 1599.        ,   868.86791294],
   [ 1598.        ,   868.87197971],
   [ 1597.        ,   868.8801087 ],
   ...,
   [ 1597.        ,   675.30378536],
   [ 1598.        ,   675.31373204],
   [ 1599.        ,   675.31870792]]), None)]
665
Can anyone help me?
Thank you in advance,
R
Solution
You should use Ellipse.get_path().vertices, but it is not in the correct coordinate system. To convert it, apply ellipse.get_patch_transform().transform to it. See a working example below
import matplotlib.pyplot as plt
from matplotlib.patches import Ellipse
from matplotlib.path import Path
from matplotlib.patches import PathPatch

img = plt.imread("image.jpg")

fig, ax = plt.subplots(1)
ax.set_aspect('equal')

ax.imshow(img)

# Create the base ellipse
ellipse = Ellipse((300, 300), width=400, height=100,
                  edgecolor='white', facecolor='none', linewidth=2)

# Get the path
path = ellipse.get_path()
# Get the list of path vertices
vertices = path.vertices.copy()
# Transform the vertices so that they have the correct coordinates
vertices = ellipse.get_patch_transform().transform(vertices)

# You can then save the vertices array to a file: csv, pickle... It's up to you

plt.show()