Extracts values from functions used by odeint scipy python
I have the following script to compute dRho using odeint.
P_r = 10e5
rho_r = 900
L = 750
H = 10
W = 150
A = H * W
V = A * L
fi = 0.17

k = 1.2e-13
c = 12.8e-9
mu = 2e-3

N = 50
dV = V/N
dx = L/N

P_in = P_r
rho_in = rho_r

P_w = 1e5
rho_w = rho_r* np.exp(c*(P_w-P_r))

# init initial case
P = np.empty(N+1)*10e5
Q = np.ones(N+1)
out = np.empty(N+1)

P[0] = P_w
Q[0] = 0
out[0] = 0

def dRho(rho_y, t, N):

P[1:N] = P_r + (1/c) * np.log(rho_y[1:N]/rho_r)
    P[N] = P_r + (1/c) * np.log(rho_y[N]/rho_r)

Q[1:N] = (-A*k/mu)*((P[1-1:N-1] - P[1:N])/dx)
    Q[N] = (-A*k/mu)*((P[N]-P_r)/dx)

out[1:N] = ((Q[1+1:N+1]*rho_y[1+1:N+1] - Q[1:N]*rho_y[1:N])/dV)
    out[N] = 0

return out

t0 = np.linspace(0,1e9, int(1e9/200))
rho0 = np.ones(N+1)*900
ti = time.time()
solve = odeint(dRho, rho0, t0, args=(N,))
plt.plot(t0,solve[:,1:len(rho0)], '-', label='dRho')
plt.legend(loc='upper right')
plt.show()
P and Q
are calculated in the function dRho, where they P acts as inputs to Q and P, Q, and rho_y as inputs to out. The function returns “out”. I can draw it without problems, however, I am also interested in drawing P and Q.
I tried multiple ways to achieve this, e.g. recalculating P and Q after the integration method, but this would increase the run time of the script. So, since the computation is done inside dRho, I’m wondering if and how to access it from the outside to plot it.
I also tried adding P and Q along with rho0 as inputs to odeint, but both P and Q were used for integration, which resulted in incorrect results when the function returned.
Simplified version:
import numpy as np
import matplotlib.pyplot as plt
from scipy.integrate import odeint
def dY(y, x):
    a = 0.001
    yin = 1
    C = 0.01
    N = 1
    dC = C/N
    b1 = 0
    y_diff = -np.copy(y)
    y_diff[0] += yin
    y_diff[1:] += y[:-1]
    print(y)
    return (a/dC)*y_diff+b1*dC

x = np.linspace(0,20,1000)
y0 = np.zeros(4)
res = odeint(dY, y0, x)
print(res)
plt.plot(x,res, '-')
plt.show()
In this simplified example, I want to create an extra ydiff graph.
Here’s another simple example:
import matplotlib.pyplot as plt
import numpy as np
from scipy.integrate import odeint

def func(z,t):
    x, y=z
    xnew = x*2
    print(xnew)
    ynew = y*0.5
#     print y
    return [x, y]

z0=[1,3]
t = np.linspace(0,10)
xx=odeint(func, z0, t)
plt.plot(t, xx[:,0],t,xx[:,1])
plt.show()
I’m interested in plotting all xnew and ynew values.
Another example:
xarr = np.ones(4)
def dY(y, x):
    a = 0.001
    yin = 1
    C = 0.01
    N = 1
    dC = C/N
    b1 = 0
    xarr[0] = 0.25
    xarr[1:] = 2
    mult = xarr*2
    out = mult * y
    print(mult)
    return out

x = np.linspace(0,20,1000)
y0 = np.zeros(4)+1.25
res = odeint(dY, y0, x)
dif = np.array([dY(y,x) for y in res])
print(dif)
plt.plot(x,res, '-')
plt.show()
I want to plot multiple values based on x
Solution
The following may be what you want. You can store intermediate values in a list and then draw the list. This also requires storing the x value.
import numpy as np
import matplotlib.pyplot as plt
from scipy.integrate import odeint

xs = []
yd = []

def dY(y, x):
    a = 0.001
    yin = 1
    C = 0.01
    N = 1
    dC = C/N
    b1 = 0
    y_diff = -np.copy(y)
    y_diff[0] += yin
    y_diff[1:] += y[:-1]
    xs.append(x)
    yd.append(y_diff)
    return (a/dC)*y_diff+b1*dC

x = np.linspace(0,20,1000)
y0 = np.zeros(4)
res = odeint(dY, y0, x)

plt.plot(x,res, '-')

plt.gca().set_prop_cycle(plt.rcParams['axes.prop_cycle'])
plt.plot(np.array(xs),np.array(yd), '-.')

plt.show()
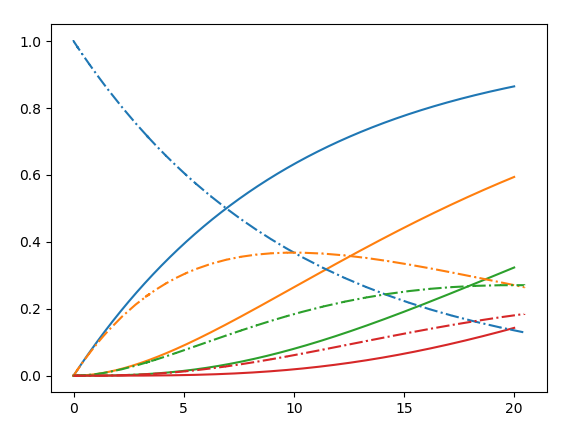
The dashed line is the y_diff value of the RES solution of the same color.