How to interpret the (unexpected) value of the sklearn.tree.tree_tree.value property?
The decision tree classifier stub used with AdaBoostClassifier corresponds to value attribute values that are not as expected, and I can’t determine what these values represent. I would like to understand the values that help analyze the behavior of the stub estimator and the contribution of the stub to AdaBoostClassifier. A similar issue to Stackoverflow has nothing to do with my data.
Version information
- python :3.6.5
- sklearn version: 0.20.2
The DecisionTreeClassifier stub is configured as:
number_estimators = 301
bdt= AdaBoostClassifier(DecisionTreeClassifier(max_depth=1),
algorithm="SAMME. R", n_estimators=number_estimators)
AdaBoostClassifier is a binary classifier with output states of Class A and Class B (encoded as +1 and -1). The training set contains 23 features, and the classifier performs well (prediction accuracy, precision, recall are all about 79%). I’m analyzing missed predictions to gain insight into classification errors.
There are 782 training samples.
The 301 stub estimators are obtained from AdaBoostClassifier by:
tree_stubs = bdt.estimators_
Example stub corresponding to the 6th estimator (0-based list):
bdt.estimators_[5]
DecisionTreeClassifier(class_weight=None, criterion='gini', max_depth=1,
        max_features=None, max_leaf_nodes=None,
        min_impurity_decrease=0.0, min_impurity_split=None,
        min_samples_leaf=1, min_samples_split=2,
        min_weight_fraction_leaf=0.0, presort=False,
        random_state=421257592, splitter='best')
The value of this stub:
stub_5.tree_.value
array([[[0.5       , 0.5       ]],
   [[0.29308331, 0.1861591 ]],
   [[0.20691669, 0.3138409 ]]])
For those familiar with graphviz, the stump looks like:
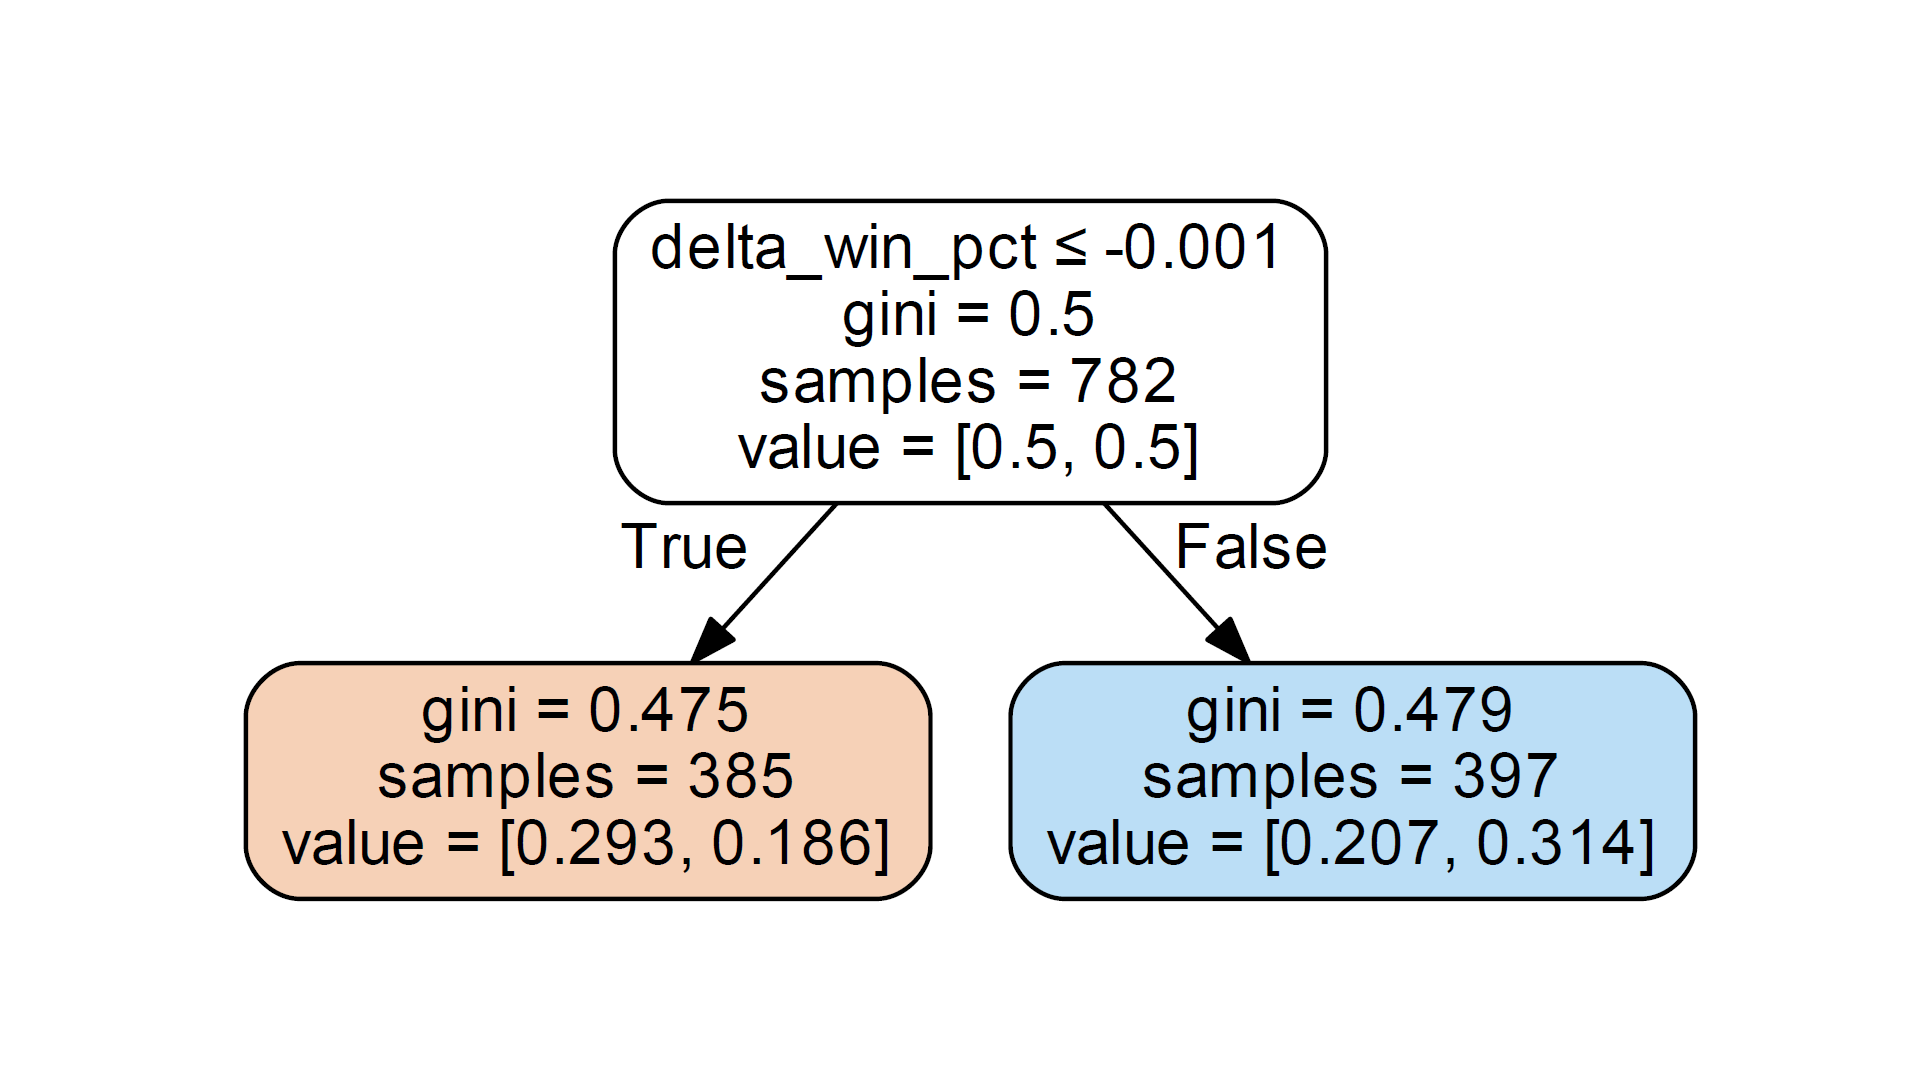
The root node correctly displays the number of samples (782). The value attribute represents [0.5, 0.5]. I expect the value property to be the number of samples in each class, not the percentage. But in the root node, the value of 0.5 does reflect the balanced training set I have, with equal representation of the two classes.
Now the problem. The splitting feature in this stub splits samples based on a delta_win_pct value that is less than or equal to the threshold value -.001. My dataset does have 385 delta_win_pct sample records below this threshold and 397 delta_win_pct samples greater than this threshold. Therefore, the sample data is correct in the left and right leaf nodes of the tree stub.
But the value data seems incorrect. In the left child node, the value is reported as value = [0.293, 0.186], and in the right child node, value = [0.207, 0.314]. Note that this is sklearn.tree._tee. The data reported by the Tree class does not indicate any problems with graphviz.
What do these value quantities represent?
Considering the left-leaf node, my dataset actually has 264 Class A samples with delta_win_pct <= -0.001 and 121 Class B samples matching that split threshold. These numbers correspond to percentages of [.6857, .3143] instead of [0.293, 0.186]. Incorrect values do not have a linear proportional relationship with expected values.
Similarly, for the
right child node, the value data is provided as [0.207, 0.314], but for the 397 samples where delta_win_pct exceeds the threshold, the expected value should be [.330, .670].
I noticed that the numbers in the provided value data (0.293, 0.186, 0.207, 0.314) add up to 1.0. But the values for each node do not add up to 1.0. I tried to use the provided value as a percentage of all samples, e.g. 0.293 * 782 = 229 is not relevant to anything.
Does anyone understand the meaning of the provided value data? Am my interpretations and expectations of these values incorrect?
Finally, I noticed that the relative size of the values in the data correlates correctly with the majority of samples in each node. A greater than 0.186 of 0.293 in the left child node indicates that the left node has most Class A samples. On the right leaf node, 0.207 < 0.314 indicates that when the threshold is delta_win_pct >, the Class B sample is in the majority. I suspect that’s why AdaBoostClassifier seems to work.
In any case, I want to understand these values of value.
Solution
I tried to reproduce it on the generated dataset :
import pydot
import numpy as np
from IPython.display import Image, display
from sklearn.externals.six import StringIO
from sklearn.tree import DecisionTreeClassifier,  _tree
from sklearn.datasets import make_classification
from sklearn.ensemble import AdaBoostClassifier

X, y = make_classification(n_informative=2, n_features=3, n_samples=200, n_redundant=1, random_state=42, n_classes=2)
feature_names = ['X0','X1','X2','X3']
clf = AdaBoostClassifier(DecisionTreeClassifier(max_depth=1),
algorithm="SAMME. R", n_estimators=301)
clf.fit(X, y)

estimator = clf.estimators_[0]
dot_data = StringIO()
tree.export_graphviz(estimator, out_file=dot_data, proportion=False, filled=True,node_ids=True,rounded=True,class_names=['0','1'])
graph = pydot.graph_from_dot_data(dot_data.getvalue()) [0]

def viewPydot(pdot):
    plt = Image(pdot.create_png())
    display(plt)
viewPydot(graph)
I found two cases, one “correct” (clf.estimators_[0]) that looks like this
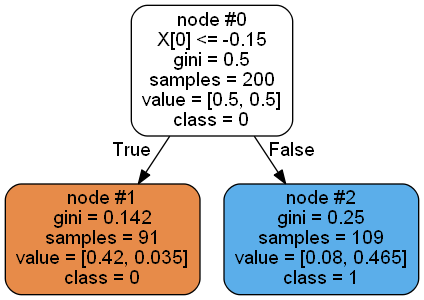
Here value represents the ratio of a particular class in the node to the total number of samples, so node#1: [84/200=0.42, 7/200=0.035], node #2: [16/200=0.08, 93/200=0.465].
If you set the proportion parameter to True, you get the percentage of class distribution for each node, for example for node #2: [16/109, 93/109] = [0.147, 0.853]. Yes calculated using weighted_n_node_samples attribute, which is equal to the number of samples for the node divided by the total number of samples, where appropriate, for example, 109/200=0.545, [0.08, 0.465]/0.545=[0.147, 0.853].
Another scenario (clf.estimators_[4]) is the one you encounter:
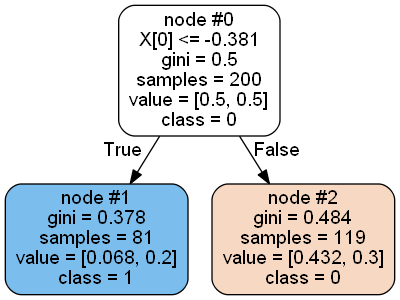
Left node class: [74, 7].
Right node class: [93, 26].
The class distribution here has nothing to do with value, and the left node even predicts a few categories.
The only suitable case seems to be the first estimator, others also have this problem, maybe this is part of the promotion procedure? Also, if you take any estimator tree and do the fitting manually, you will get the same number as the first estimator, for example
>>> DecisionTreeClassifier(class_weight=None, criterion='gini', max_depth=1,
            max_features=None, max_leaf_nodes=None,
            min_impurity_decrease=0.0, min_impurity_split=None,
            min_samples_leaf=1, min_samples_split=2,
            min_weight_fraction_leaf=0.0, presort=False,
            random_state=441365315, splitter='best').fit(X,y).tree_.value
array([[[100., 100.]],

[[ 84.,   7.]],

[[ 16.,  93.]]])