Matplotlib sets the bar width of all subgraphs to the same size… here is a solution to the problem.
Matplotlib sets the bar width of all subgraphs to the same size
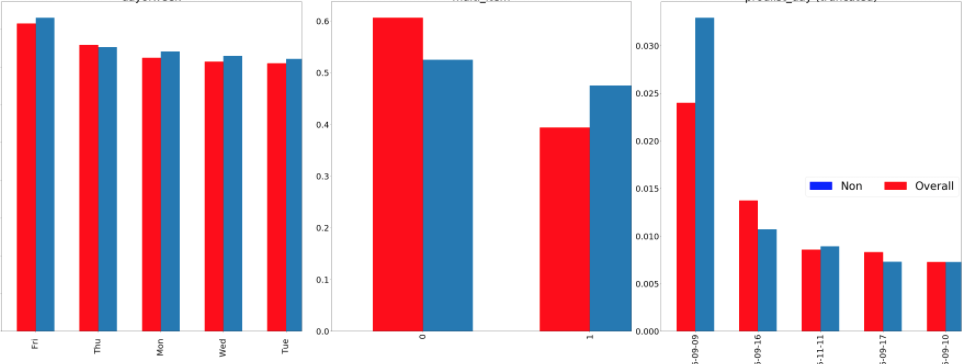
I have 3 subgraphs in the image below. I set the width of each subplot to 0.3, but now the bar chart is unevenly sized. How do I make the bars the same size while maintaining the spacing between two pairs of bars?
My code:
    g=['col1','col2','col3']
    fig, axs = plt.subplots(1,len(g)/1,figsize = (50,20))
    axs = axs.ravel()

for j,x in enumerate(g):
        df_plot[x].value_counts(normalize=True).head().plot(kind='bar',ax=axs[j],position = 0, title = 'mytitle', fontsize = 30, width=0.3)
        df_plot2[x].value_counts(normalize=True).head().plot(kind='bar',ax=axs[j],position = 1, color='red', width=0.3)
        axs[j].title.set_size(40)
        fig.tight_layout()
Solution
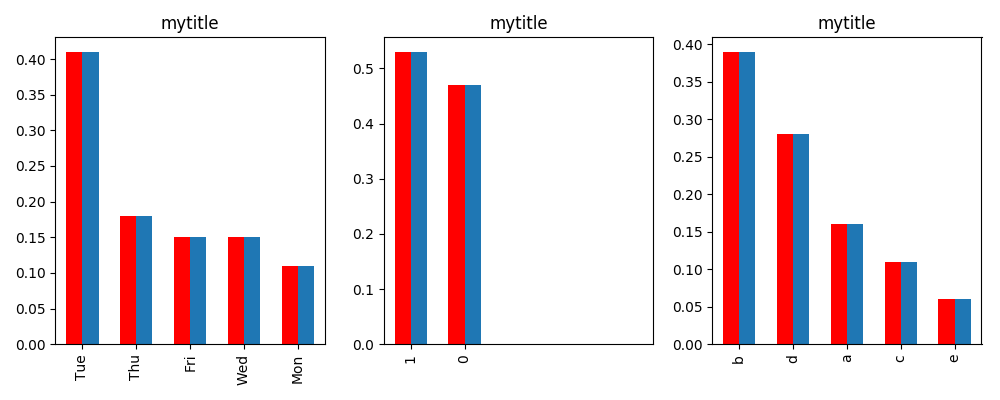
If all subgraphs should have the same size, the idea is to set the limit on the x-axis so that all bars have the same width.
ax.set_xlim(-0.5,maxn-0.5)
where maxn is the maximum number of bars to plot.
import pandas as pd
import matplotlib.pyplot as plt
import numpy as np

col1 = np.random.choice(["Mon", "Tue", "Wed", "Thu", "Fri"], 100, p=[0.1, 0.4, 0.2, 0.2,0.1])
col2 = np.random.choice([0,1], 100, p=[0.4, 0.6])
col3 = np.random.choice(list("abcde"), 100, p=[0.15, 0.35, 0.1, 0.3,0.1])
df = pd. DataFrame({'col1':col1,'col2':col2,'col3':col3})

g=['col1','col2','col3']
fig, axs = plt.subplots(1,len(g)/1,figsize = (10,4))
axs = axs.ravel()

maxn = 5
for j,x in enumerate(g):
    df[x].value_counts(normalize=True).head().plot(kind='bar',ax=axs[j],position = 0, title = 'mytitle', width=0.3)
    df[x].value_counts(normalize=True).head().plot(kind='bar',ax=axs[j],position = 1, color='red', width=0.3)
    axs[j].set_xlim(-0.5,maxn-0.5)

fig.tight_layout()
plt.show()