matplotlib tables are clipped… here is a solution to the problem.
matplotlib tables are clipped
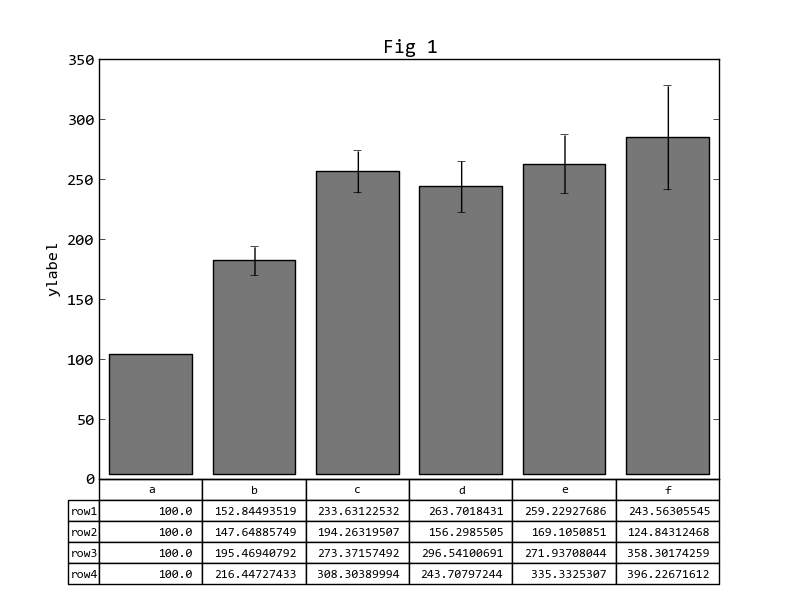
I tried to get a table from a numpy array at the bottom of the bar chart but it was clipped, here’s the code:
import matplotlib.pyplot as plt
import pylab as p
import numpy as np

a = np.array([[ 100.        ,  152.84493519,  233.63122532,  263.7018431 ,
                259.22927686,  243.56305545],
              [ 100.        ,  147.64885749,  194.26319507,  156.2985505 ,
                169.1050851 ,  124.84312468],
              [ 100.        ,  195.46940792,  273.37157492,  296.54100691,
                271.93708044,  358.30174259],
              [ 100.        ,  216.44727433,  308.30389994,  243.70797244,
                335.3325307 ,  396.22671612]])
fig = p.figure()
ax = fig.add_subplot(1,1,1)

y = np.mean(a, axis=0)
N = len(y)
ind = range(N)
err = np.std(a, axis=0)/np.sqrt(N)

ax.bar(ind, y, facecolor='#777777',
       align='center', yerr=err, ecolor='black',
       bottom=4)
ax.set_ylabel('ylabel')

ax.set_title('Counts, by group',fontstyle='italic')

tfig = 'Fig 1'
ax.set_title(tfig, fontstyle='italic')

labels = ['a', 'b', 'c', 'd', 'e', 'f']
rowlab = ['row1', 'row2', 'row3', 'row4']
ax.set_xticklabels(labels)
ax.xaxis.set_visible(False)
the_table = ax.table(cellText=a, colLabels=labels, rowLabels=rowlab)
table_props = the_table.properties()
table_cells = table_props['child_artists']
for cell in table_cells:
    cell.set_fontsize(12)
    cell.set_height(0.05)

fig.savefig(('prueba.png'), dpi=300)

How do I
get the whole table, and how do I align the bars with each column?
Solution
Add the following two lines to the code before saving the graph:
ax.set_xlim(-0.5, 5.5)
p.subplots_adjust(bottom=0.2)