Use variables in a for loop to assign legend values in pyplot… here is a solution to the problem.
Use variables in a for loop to assign legend values in pyplot
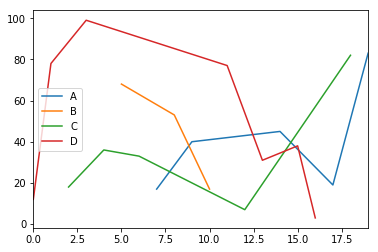
I have a DataFrame with multiple columns, including name, date, and statistics. I’m charting statistics over time and trying to make the legend for each line match the name.
Every time I try something new, I either get the column name of the statistic or a name from the name column that is repeated twice or truncated.
Can I use an existing for loop to have both names appear in the legend?
fig, ax = plt.subplots()
for name, group in statistics.groupby('A name'):
    group.plot(ax=ax, label=name)
    print(name)

plt.legend()
This code prints two separate lines on the chart, giving each line the column name of the statistic I’m plotting, not the person’s name, which is what I’m trying to use label=name. The print statement in the for loop prints the name correctly.
How do I set the label to equal the correct name for each drawn line?
Solution
You need to capture those line handles:
statistics = pd. DataFrame({'A name':pd.np.random.choice(list('ABCD'),20),'Data Values':np.random.randint(0,100,20)})
fig, ax = plt.subplots()
lh = {}
for name, group in statistics.groupby('A name'):
    lh[name] = group.plot(ax=ax, label=name)
    print(name)

plt.legend(lh)