MPAndroidChart Bar Chart – How to group bars at random x-axis intervals between groups?
I want to make a bar chart with 3 different datasets grouped together at each data point as shown below:
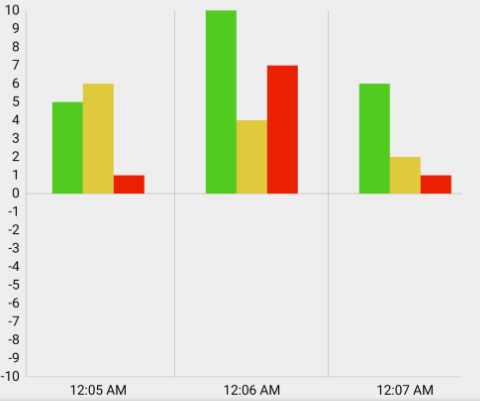
However, I
can’t group the bars together using the groupBars method provided by the library, because whatever x value I set for an entry, it will be based on my arguments in it.
For example, if I generate a dataset containing the x-values {0, 5, 13, 17…50} of the entries and call “groupBars”, all my entries will be collected separately with 1 x value like this:
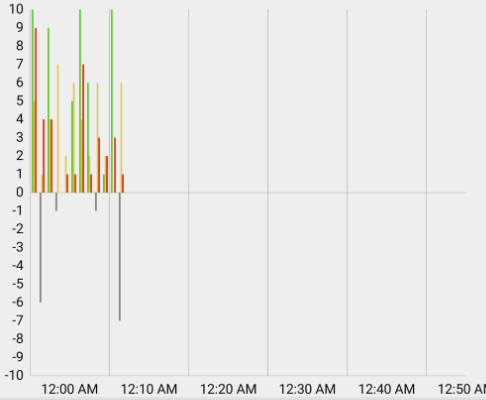
What I want is for each bar to be grouped and each bar visible at its specified x value. If I simply remove the groupBars call, I get something similar to what I want but not entirely because the bars are all overlapping, like this :
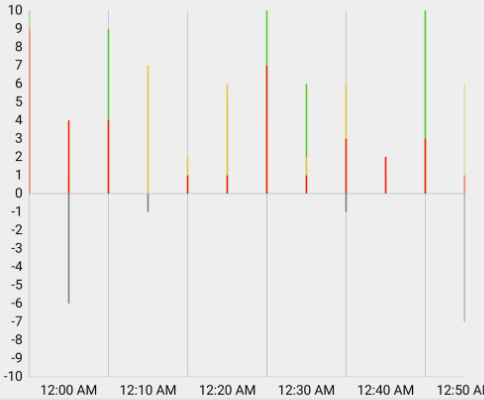
How do I get results similar to the image above, but with bars fully visible for each dataset? This is the code I used to generate the dataset and group the bar chart:
        ArrayList<BarEntry> happinessValues = new ArrayList<>();
        ArrayList<BarEntry> stressValues = new ArrayList<>();
        ArrayList<BarEntry> painValues = new ArrayList<>();

for (int i = 0; i < 50; ++i) {
            happinessValues.add(new BarEntry(
                    i,
                    datapoint.getHappiness()));
            stressValues.add(new BarEntry(
                    i,
                    datapoint.getStress()));
            painValues.add(new BarEntry(
                    i,
                    datapoint.getPain()));
        }

HappinessDataset happyDataset;

BarDataSet stressDataset, painDataset;

happyDataset = new HappinessDataset(happinessValues, "Happiness");

stressDataset = new BarDataSet(stressValues, "Stress");

painDataset = new BarDataSet(painValues, "Pain");

BarData data = new BarData(happyDataset, stressDataset, painDataset);

mChart.setData(data);

mChart.getXAxis().setAxisMinimum(0);
        mChart.getXAxis().setAxisMaximum(50);

float groupSpace = 0.4f;
        float barSpace = 0f;  x3 DataSet
        float barWidth = 0.2f;  x3 DataSet
         (0.2 + 0) * 3 + 0.4 = 1.00 -> interval per "group"
        mChart.groupBars(startTime, groupSpace, barSpace);
Solution
I’ve solved this problem by modifying the x value and bar width of each bar entry.
I created a new BarData class with these three datasets and set the bar width (let’s call it BAR_WIDTH) to 0.2 (i.e. three bars together will occupy 0.6 units of space and will have 0.4 spacing units after the dataset).
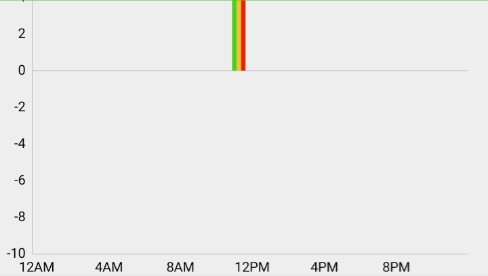
For any given bar entry, I place the first bar at the x
value I want (let’s call it i), my second bar at the x value at i+BAR_WIDTH, and the third bar at i+2*BAR_WIDTH. The result is a set of 3 bar entries, centered on any x value I want, like this:
So in my code above, modify the bar-entry creation code as follows:
final float BAR_WIDTH = 0.2f;

happinessValues.add(new BarEntry(
                        i,
                        datapoint.getHappiness()));
                stressValues.add(new BarEntry(
                        i + BAR_WIDTH,
                        datapoint.getStress()));
                painValues.add(new BarEntry(
                        i + 2 * BAR_WIDTH,
                        datapoint.getPain()));

mChart.getBarData().setBarWidth(BAR_WIDTH);