blit with subgraph draws only the last subgraph
I’m trying to plot multiple subgraphs in real time in my python application. Ideally, I should also be able to draw multiple lines in each subgraph, but for simplicity, I’m assuming that one line is drawn in each subgraph.
To do this effectively (I’m looking for quick drawings), I’m trying to combine an example I found online (https://taher-zadeh.com/speeding-matplotlib-plotting-times-real-time-monitoring-purposes/ ) extends to my case. My code is:
import time
# for Mac OSX
import matplotlib
matplotlib.use('TkAgg')
import matplotlib.pylab as plt
import random

def test_fps(use_blit=True):

ax1.cla()
    ax1.set_title('Sensor Input vs. Time -')
    ax1.set_xlabel('Time (s)')
    ax1.set_ylabel('Sensor Input (mV)')
    ax2.cla()
    ax2.set_title('Sensor Input vs. Time -' )
    ax2.set_xlabel('Time (s)')
    ax2.set_ylabel('Sensor Input (mV)')
    ax3.cla()
    ax3.set_title('Sensor Input vs. Time -')
    ax3.set_xlabel('Time (s)')
    ax3.set_ylabel('Sensor Input (mV)')
    ax4.cla()
    ax4.set_title('Sensor Input vs. Time -')
    ax4.set_xlabel('Time (s)')
    ax4.set_ylabel('Sensor Input (mV)')

plt.ion()  # Set interactive mode ON, so matplotlib will not be blocking the window
    plt.show(False)  # Set to false so that the code doesn't stop here

cur_time = time.time()
    ax1.hold(True)
    ax2.hold(True)
    ax3.hold(True)
    ax4.hold(True)

x, y = [], []
    times = [time.time() - cur_time]  # Create blank array to hold time values
    y.append(0)

line1, = ax1.plot(times, y, '.-', alpha=0.8, color="gray", markerfacecolor="red")
    line2, = ax2.plot(times, y, '.-', alpha=0.8, color="gray", markerfacecolor="red")
    line3, = ax3.plot(times, y, '.-', alpha=0.8, color="gray", markerfacecolor="red")
    line4, = ax4.plot(times, y, '.-', alpha=0.8, color="gray", markerfacecolor="red")

fig.show()
    fig.canvas.draw()

if use_blit:
        background1 = fig.canvas.copy_from_bbox(ax1.bbox) # cache the background
        background2 = fig.canvas.copy_from_bbox(ax2.bbox) # cache the background
        background3 = fig.canvas.copy_from_bbox(ax3.bbox) # cache the background
        background4 = fig.canvas.copy_from_bbox(ax4.bbox) # cache the background

tic = time.time()

niter = 200
    i = 0
    while i < niter:

fields = random.random() * 100

times.append(time.time() - cur_time)
        y.append(fields)

# this removes the tail of the data so you can run for long hours. You can cache this
        # and store it in a pickle variable in parallel.

if len(times) > 50:
           del y[0]
           del times[0]

xmin, xmax, ymin, ymax = [min(times) / 1.05, max(times) * 1.1, -5,110]

# feed the new data to the plot and set the axis limits again
        plt.axis([xmin, xmax, ymin, ymax])

if use_blit:
            fig.canvas.restore_region(background1)    # restore background
            line1.set_xdata(times)
            line1.set_ydata(y)
            ax1.draw_artist(line1)                   # redraw just the points
            fig.canvas.blit(ax1.bbox)                # fill in the axes rectangle

fig.canvas.restore_region(background2)    # restore background
            line2.set_xdata(times)
            line2.set_ydata(y)
            ax2.draw_artist(line2)                   # redraw just the points
            fig.canvas.blit(ax2.bbox)

fig.canvas.restore_region(background3)    # restore background
            line3.set_xdata(times)
            line3.set_ydata(y)
            ax3.draw_artist(line3)                   # redraw just the points
            fig.canvas.blit(ax3.bbox)

fig.canvas.restore_region(background4)    # restore background
            line4.set_xdata(times)
            line4.set_ydata(y)
            ax4.draw_artist(line4)                   # redraw just the points
            fig.canvas.blit(ax4.bbox)

else:
            fig.canvas.draw()

fig.canvas.flush_events()

i += 1

fps = niter / (time.time() - tic)
    return fps
and
fig = plt.figure()
ax1 = fig.add_subplot(4, 1, 1)
ax2 = fig.add_subplot(4, 1, 2)
ax3 = fig.add_subplot(4, 1, 3)
ax4 = fig.add_subplot(4, 1, 4)
fps1 = test_fps(use_blit=True)
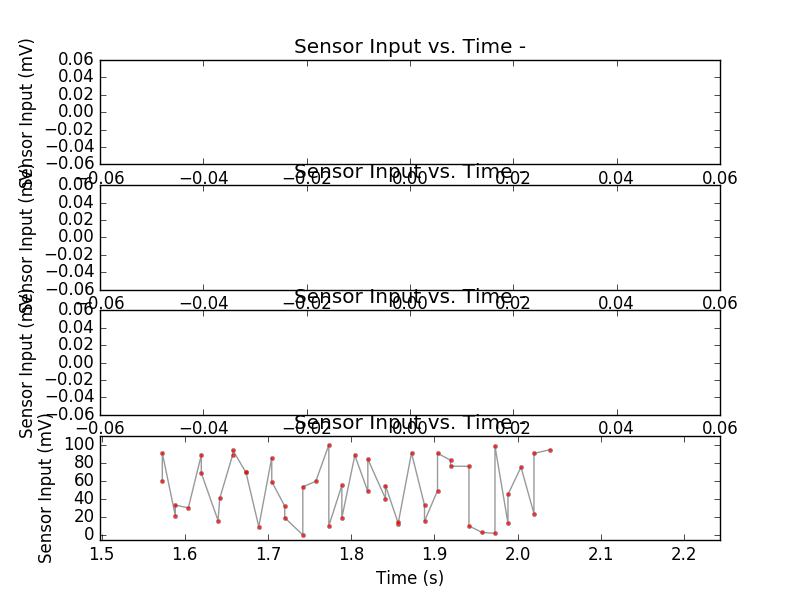
The problem with this code is that it only draws to the last subgraph, leaving the other subgraphs blank.
I’m new to python and I guess it’s a pretty stupid question, but I haven’t figured it out yet, so every hint would be helpful to me.
Thanks
Solution
In the current implementation, you set the axis limit only for the last graph, i.e. plt.axis([xmin, xmax, ymin, ymax]) applies to the last event subgraph.
Instead, you need to update all axes ax1 to ax4
ax1.axis([xmin, xmax, ymin, ymax])
ax2.axis([xmin, xmax, ymin, ymax])
ax3.axis([xmin, xmax, ymin, ymax])
ax4.axis([xmin, xmax, ymin, ymax])
Let their limits follow the data.
Also, it seems beneficial to update the data outside of the blitting condition so that people can compare blitting without blitting.
Full code:
import time
import matplotlib
matplotlib.use('TkAgg')
import matplotlib.pylab as plt
import random

def test_fps(use_blit=True):

ax1.cla()
    ax1.set_title('Sensor Input vs. Time -')
    ax1.set_xlabel('Time (s)')
    ax1.set_ylabel('Sensor Input (mV)')
    ax2.cla()
    ax2.set_title('Sensor Input vs. Time -' )
    ax2.set_xlabel('Time (s)')
    ax2.set_ylabel('Sensor Input (mV)')
    ax3.cla()
    ax3.set_title('Sensor Input vs. Time -')
    ax3.set_xlabel('Time (s)')
    ax3.set_ylabel('Sensor Input (mV)')
    ax4.cla()
    ax4.set_title('Sensor Input vs. Time -')
    ax4.set_xlabel('Time (s)')
    ax4.set_ylabel('Sensor Input (mV)')

plt.ion()  # Set interactive mode ON, so matplotlib will not be blocking the window
    plt.show(False)  # Set to false so that the code doesn't stop here

cur_time = time.time()
    #    ax1.hold(True)
    #    ax2.hold(True)
    #    ax3.hold(True)
    #    ax4.hold(True)

x, y = [], []
    times = [time.time() - cur_time]  # Create blank array to hold time values
    y.append(0)

line1, = ax1.plot(times, y, '.-', alpha=0.8, color="gray", markerfacecolor="red")
    line2, = ax2.plot(times, y, '.-', alpha=0.8, color="gray", markerfacecolor="red")
    line3, = ax3.plot(times, y, '.-', alpha=0.8, color="gray", markerfacecolor="red")
    line4, = ax4.plot(times, y, '.-', alpha=0.8, color="gray", markerfacecolor="red")

fig.show()
    fig.canvas.draw()

if use_blit:
        background1 = fig.canvas.copy_from_bbox(ax1.bbox) # cache the background
        background2 = fig.canvas.copy_from_bbox(ax2.bbox) # cache the background
        background3 = fig.canvas.copy_from_bbox(ax3.bbox) # cache the background
        background4 = fig.canvas.copy_from_bbox(ax4.bbox) # cache the background

tic = time.time()

niter = 200
    i = 0
    while i < niter:

fields = random.random() * 100

times.append(time.time() - cur_time)
        y.append(fields)

# this removes the tail of the data so you can run for long hours. You can cache this
        # and store it in a pickle variable in parallel.

if len(times) > 50:
           del y[0]
           del times[0]

xmin, xmax, ymin, ymax = [min(times) / 1.05, max(times) * 1.1, -5,110]

# feed the new data to the plot and set the axis limits again
        ax1.axis([xmin, xmax, ymin, ymax])
        ax2.axis([xmin, xmax, ymin, ymax])
        ax3.axis([xmin, xmax, ymin, ymax])
        ax4.axis([xmin, xmax, ymin, ymax])

line1.set_data(times, y)
        line2.set_data(times, y)
        line3.set_data(times, y)
        line4.set_data(times, y)

if use_blit:
            fig.canvas.restore_region(background1)    # restore background
            ax1.draw_artist(line1)                   # redraw just the points
            fig.canvas.blit(ax1.bbox)                # fill in the axes rectangle

fig.canvas.restore_region(background2)    # restore background
            ax2.draw_artist(line2)                   # redraw just the points
            fig.canvas.blit(ax2.bbox)

fig.canvas.restore_region(background3)    # restore background
            ax3.draw_artist(line3)                   # redraw just the points
            fig.canvas.blit(ax3.bbox)

fig.canvas.restore_region(background4)    # restore background
            ax4.draw_artist(line4)                   # redraw just the points
            fig.canvas.blit(ax4.bbox)

else:
            fig.canvas.draw()

fig.canvas.flush_events()

i += 1

fps = niter / (time.time() - tic)
    return fps

fig = plt.figure()
ax1 = fig.add_subplot(4, 1, 1)
ax2 = fig.add_subplot(4, 1, 2)
ax3 = fig.add_subplot(4, 1, 3)
ax4 = fig.add_subplot(4, 1, 4)
fps1 = test_fps(use_blit=True)
print fps1
Note that this didn’t run at 10fps blitting and 16fps blitting when running on my computer.