Calculates the sum of image pixels along a circular path… here is a solution to the problem.
Calculates the sum of image pixels along a circular path
I
have an image where I am trying to calculate the line integral (sum) along the circular path. My thoughts are:
- Calculates the loop path sum
- The image is masked according to the path, and everything is zeroed out except for the pixels that coincide with the path.
- Sum all image pixels
I’m currently stuck between step one and step two, not knowing how to generate a circle on the same grid as the image.
In the code:
from scipy.stats import multivariate_normal
radius = 2
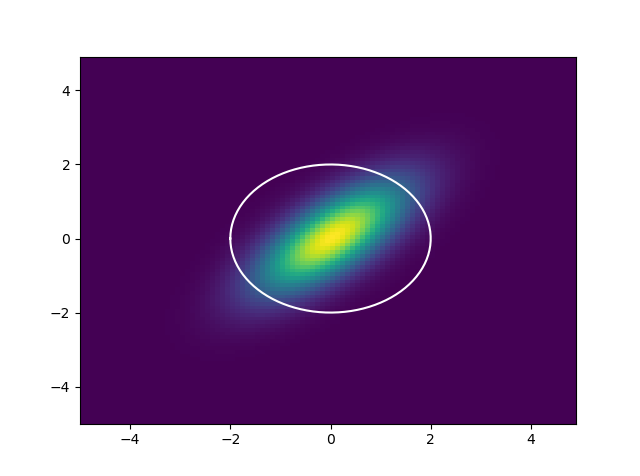
# Draw arbitrary image
x, y = np.mgrid[-5:5:.1, -5:5:.1]
img = multivariate_normal.pdf(np.dstack((x, y)), cov=[[1, 0.7], [0.7, 1]])
# generate circle with desired radius
circle = radius*np.exp(1j*np.linspace(-np.pi, np.pi, 100))
pyplot.pcolormesh(x, y, img)
pyplot.plot(np.real(circle), np.imag(circle), '-w')
pyplot.show()
Give:
Question:
How do I use a circle to mask image pixels that coincide with that circle?
Solution
This is another way to calculate integrals: it uses interpolation, makes the image a function defined on a rectangle, and then calculates the path integral using the standard integral solver.
from scipy.integrate import quad
from scipy.interpolate import RectBivariateSpline
from scipy.stats import multivariate_normal
import numpy as np

x, y = np.ogrid[-5:5:.1, -5:5:.1]
img = multivariate_normal.pdf(np.dstack(np.broadcast_arrays(x, y)),
                              cov=[[1, 0.7], [0.7, 1]])

f = RectBivariateSpline(x.ravel(), y.ravel(), img)

radius, centerx, centery = 3.0, 1.0, -1.5
def integrand(rad):
    return f(centerx+radius*np.cos(rad), centery+radius*np.sin(rad))

def true_integrand(rad):
    return multivariate_normal(cov=[[1, 0.7], [0.7, 1]]).pdf(
        (centerx+radius*np.cos(rad), centery+radius*np.sin(rad)))

print(quad(integrand, -np.pi, np.pi))
print(quad(true_integrand, -np.pi, np.pi))
Output:
(0.07985467350026378, 1.3411796499850778e-08)
(0.07985453947958436, 4.006916325573184e-11)