clips matplotlib imshow to a range of values… here is a solution to the problem.
clips matplotlib imshow to a range of values
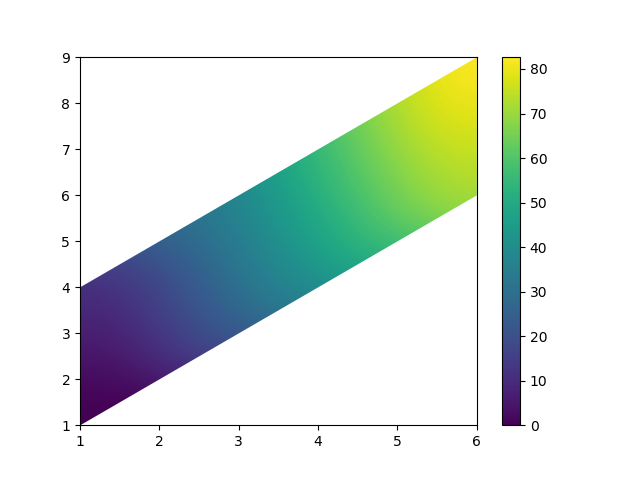
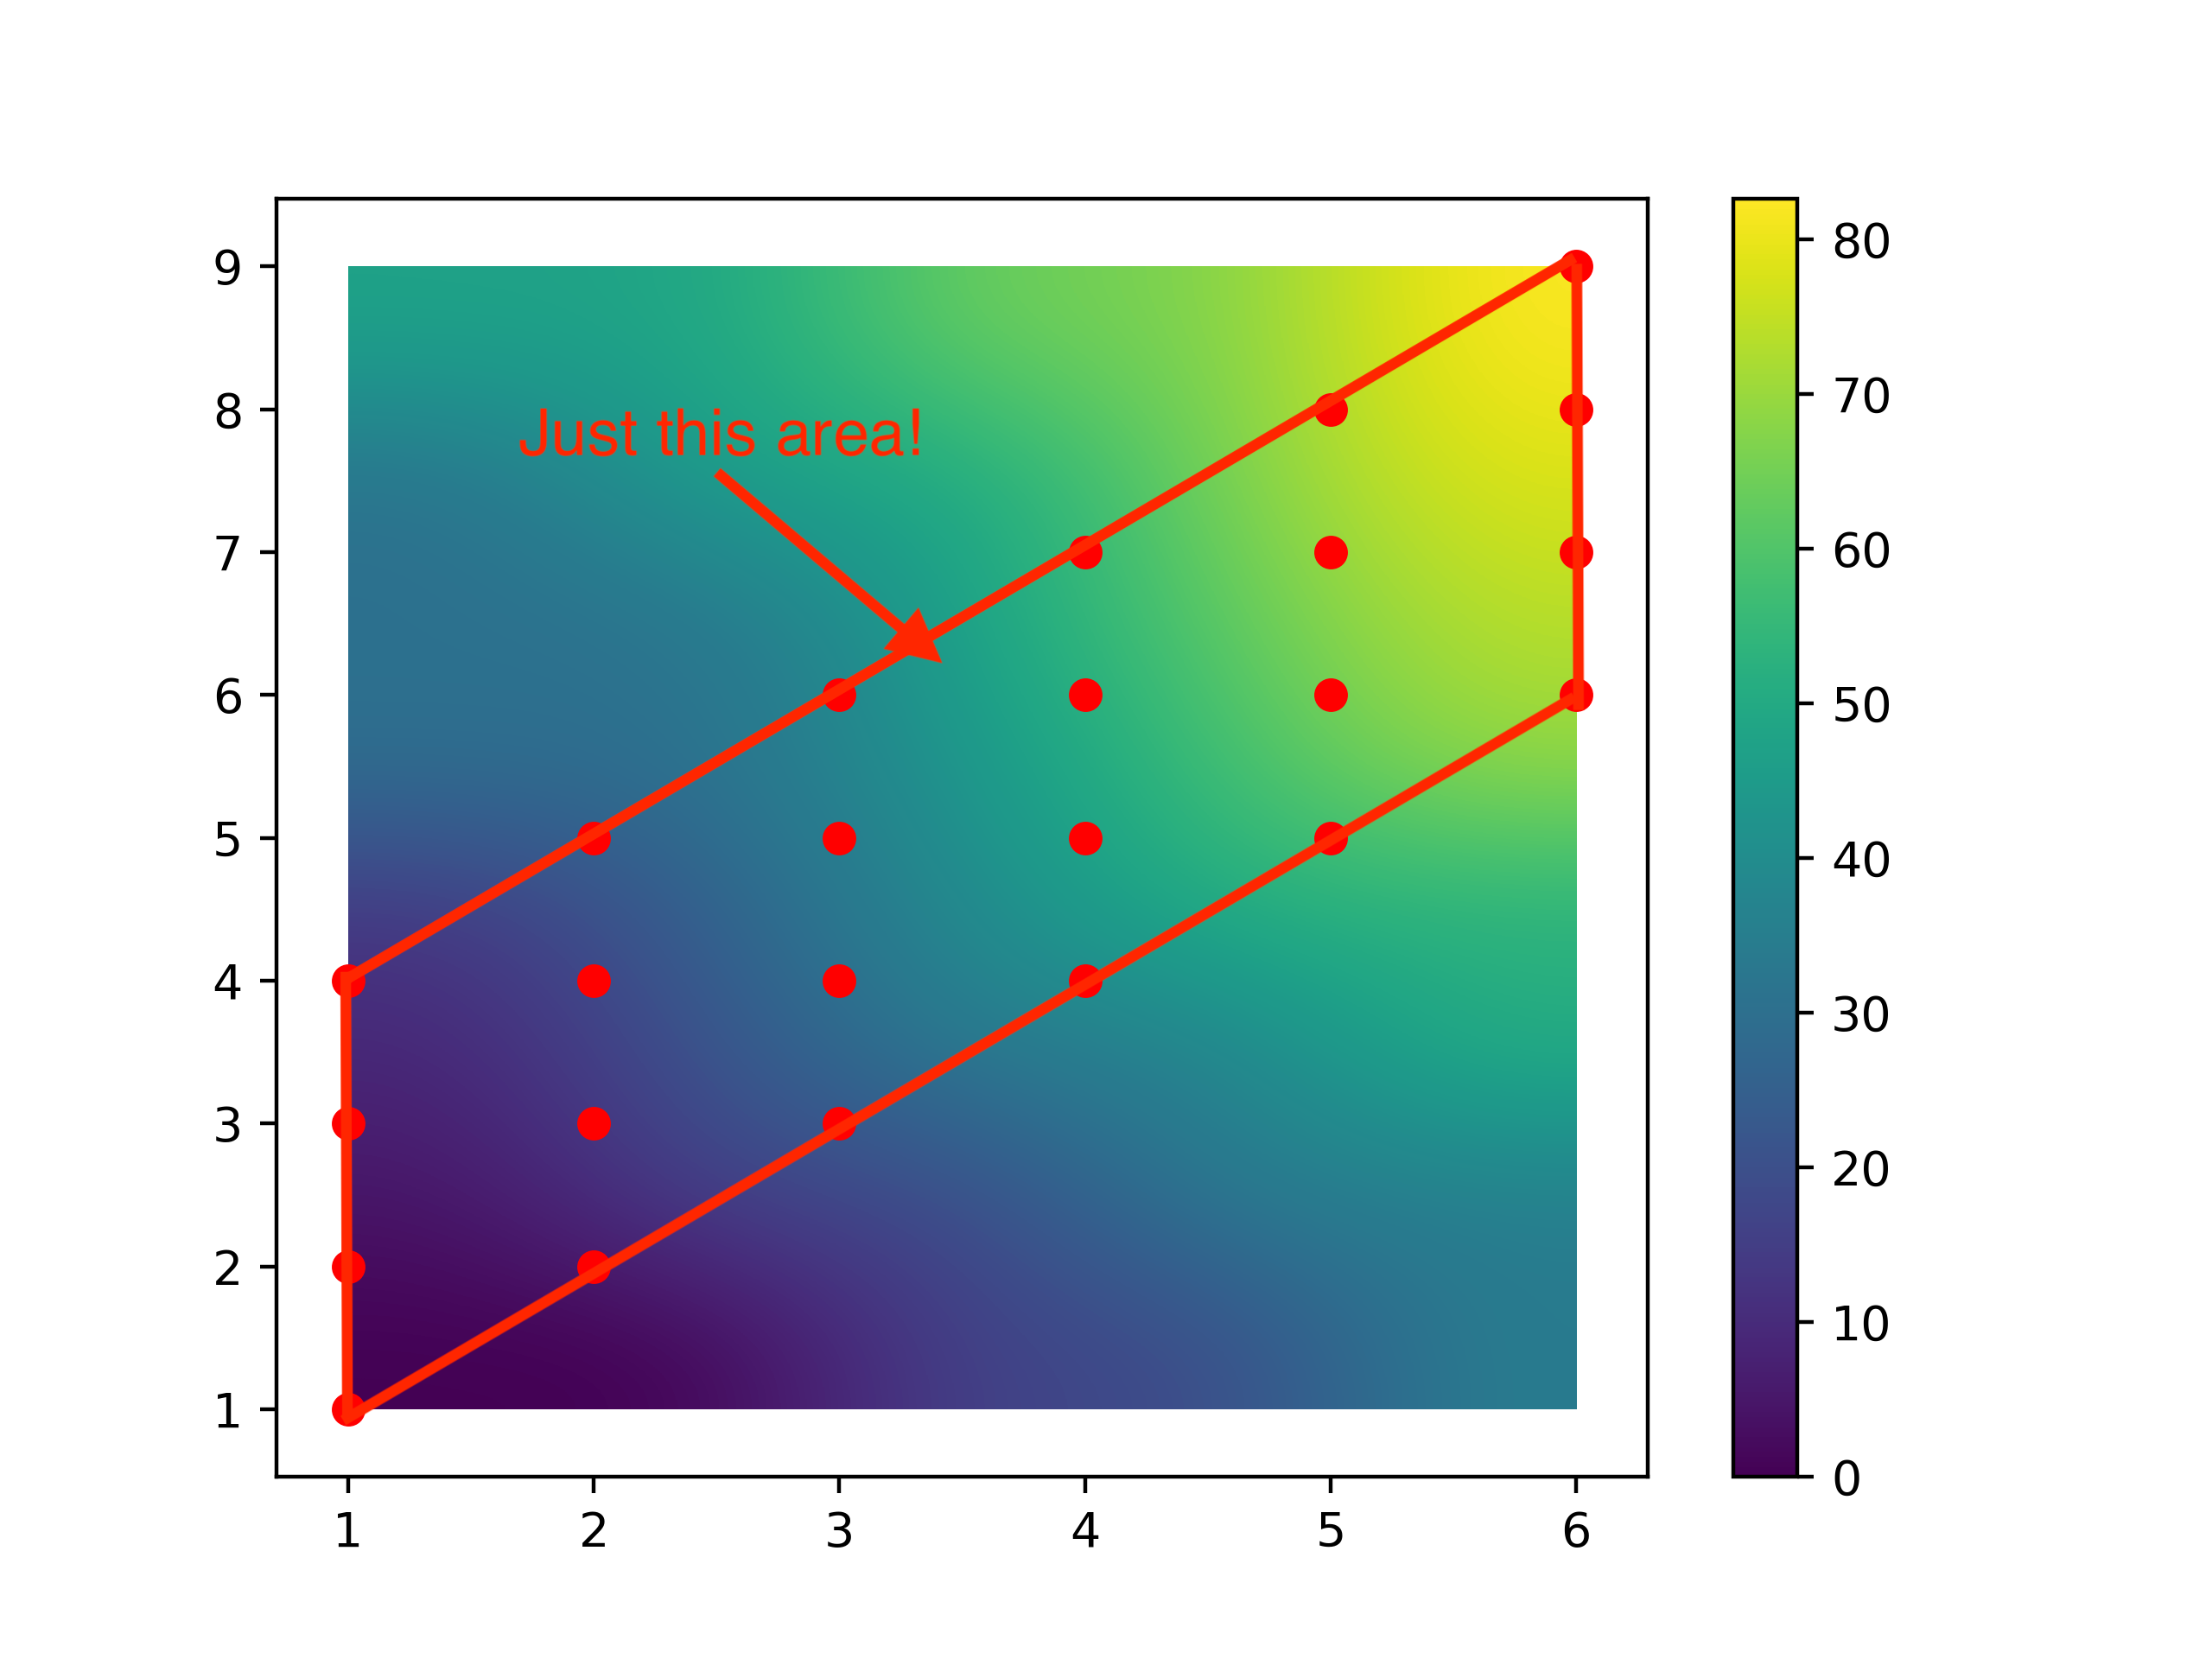
I’m trying to interpolate surfaces based on geophysics in the form of x, y, z points. I want to crop the surface to the extent of the survey (for example, I only want the area inside the red border in the image below).
Does anyone know how? Here is some sample code that generates the following image. I need to figure out how to modify it to insert only the area inside the red border.
# Import libs
import numpy as np
import matplotlib.pyplot as plt
from scipy.interpolate import griddata

# Create some example data
x = np.array([1,1,1,1,2,2,2,2,3,3,3,3,4,4,4,4,5,5,5,5,6,6,6,6])
y = np.array([1,2,3,4,2,3,4,5,3,4,5,6,4,5,6,7,5,6,7,8,6,7,8,9])
z = np.linspace(0,100,len(y))

# Grid and interpolate between points
yi, xi = np.mgrid[int(y.min()):int(y.max()),int(x.min()):int(x.max())]
zi = griddata((x, y), z, (xi, yi), method='nearest')

# Plot the figure
plt.imshow(
  zi, extent=[x.min(), x.max(), y.min(), y.max()],
  origin="lower", interpolation='bicubic', aspect='auto'
)
plt.colorbar()
plt.scatter(x,y, c = 'r')
plt.show()
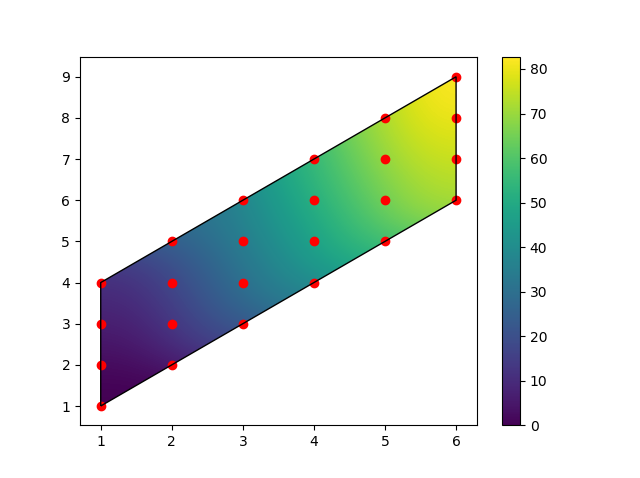
Solution
From docs My method is:
# Import libs
import numpy as np
import matplotlib.pyplot as plt
from scipy.interpolate import griddata

from matplotlib.path import Path
from matplotlib.patches import PathPatch

# Create some example data
x = np.array([1,1,1,1,2,2,2,2,3,3,3,3,4,4,4,4,5,5,5,5,6,6,6,6])
y = np.array([1,2,3,4,2,3,4,5,3,4,5,6,4,5,6,7,5,6,7,8,6,7,8,9])
z = np.linspace(0,100,len(y))

# Grid and interpolate between points
yi, xi = np.mgrid[int(y.min()):int(y.max()),int(x.min()):int(x.max())]
zi = griddata((x, y), z, (xi, yi), method='nearest')

# Plot the figure
im = plt.imshow(
  zi, extent=[x.min(), x.max(), y.min(), y.max()],
  origin="lower", interpolation='bicubic', aspect='auto',
  clip_path=patch, clip_on=True)

plt.colorbar()

path = Path([[1, 1], [1, 4], [6, 9], [6, 6], [1, 1]])
patch = PathPatch(path, facecolor='none')

plt.gca().add_patch(patch)
im.set_clip_path(patch)
To calculate the corner points of your area, you can define a function:
def corners(x, y):
    xl = np.min(x)
    yl = np.min(y)
    xh = np.max(x)
    yh = np.max(y)
    return [[xl, yl], [xl, np.max(y[x==xl])], [xh, yh], [xh, np.min(y[x==xh])], [xl, yl]]
and replace the explicit dot in the patch with:
...
path = Path(corners(x, y))
...
Edit:
with
patch = PathPatch(path, facecolor='none', edgecolor='none')
You can crop purely without having to show the edges of the clipping path.