How do I set the origin of a mesh using mplot3d?
Follow scikit-image doc For example, I use the traveling cube algorithm to generate a spherical mesh. I want to center the unit spherical shell at the origin defined by the x, y, z grid. However, I can’t do that because I don’t know how to put x, y, z information using mpl_toolkits.mplot3d.art3d.Poly3DCollection. Here is the code:
import matplotlib.pyplot as plt
from mpl_toolkits.mplot3d.art3d import Poly3DCollection
from skimage import measure
import numpy as np

x, y, z = np.ogrid[-4:4:20j, -4:4:20j, -4:4:20j]
r = np.sqrt(x ** 2 + y ** 2 + z ** 2)
verts, faces, normals, values = measure.marching_cubes_lewiner(r,level=1)
fig = plt.figure(figsize=(10, 10))
ax = fig.add_subplot(111, projection='3d')
mesh = Poly3DCollection(verts[faces])
mesh.set_edgecolor('k')
ax.add_collection3d(mesh)
plt.show()
The problem is that the marching_cubes_lewiner function does not consider x,y,z. How can I center the resulting sphere at 0,0,0 as the mesh suggests?
Solution
measure.marching_cubes_ Lewiner uses the index of the points in the grid to calculate the topology. It doesn’t seem to have a way to specify the actual grid, nor any offsets.
Therefore, you can manipulate the generated verts the way you want. IE。 You can first multiply the difference between the grid points to effectively scale the output, and then add the offset of the mesh. In this case, the conversion will be newverts = 0.42105 * oldverts - 4.
import numpy as np
import matplotlib.pyplot as plt
from mpl_toolkits.mplot3d.art3d import Poly3DCollection
from skimage import measure
x, y, z = np.ogrid[-4:4:20j, -4:4:20j, -4:4:20j]
r = np.sqrt(x ** 2 + y ** 2 + z ** 2)
verts, faces, normals, values = measure.marching_cubes_lewiner(r, level=1)
verts *= np.array([np.diff(ar.flat)[0] for ar in [x,y,z]])
verts += np.array([x.min(),y.min(),z.min()])
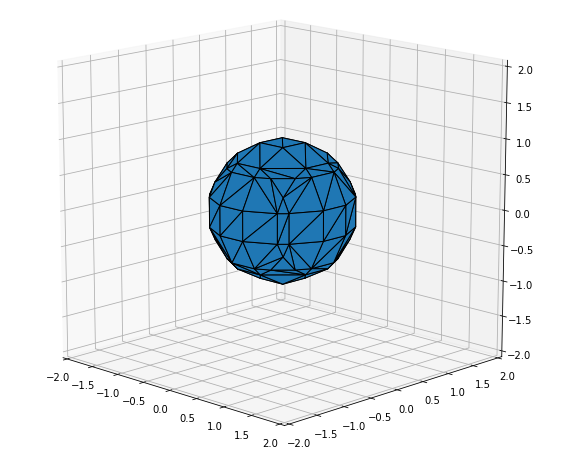
fig = plt.figure(figsize=(10, 10))
ax = fig.add_subplot(111, projection='3d')
mesh = Poly3DCollection(verts[faces])
mesh.set_edgecolor('k')
ax.add_collection3d(mesh)
ax.set_xlim(-2, 2)
ax.set_ylim(-2, 2)
ax.set_zlim(-2, 2)
plt.show()