Loop the map without drawing the previous point
I’m trying to draw points floating in the sea. The following code works, but also plots all the points of the previous plot:
Duration = 6 #hours

plt.figure(figsize=(20,10))#20,10
map = Basemap(width=300000,height=300000,projection='lcc',
        resolution='c',lat_0=51.25,lon_0=-4)#lat_0lon_0 is left under
map.drawmapboundary(fill_color='turquoise')
map.fillcontinents(color='white',lake_color='aqua')
map.drawcountries(linestyle='--')

x=[]
y=[]
for i in range (0,Duration):

x,y = map(Xpos1[i],Ypos1[i])
    map.scatter(x, y, s=1, c='k', marker='o', label = 'Aurelia aurita', zorder=2)
    plt.savefig('GIF10P%d' %i)
Xpos1 and Ypos1 are lists of mask arrays. Each array in the list is 10 in length, so 10 points should be plotted in each plot:
 Xpos1=[[latitude0,lat1,lat2,lat3,..., lat9],
       [latitude0,lat1,lat2,lat3,..., lat9],...]
This gives me six numbers, I’ll tell you the first and last:

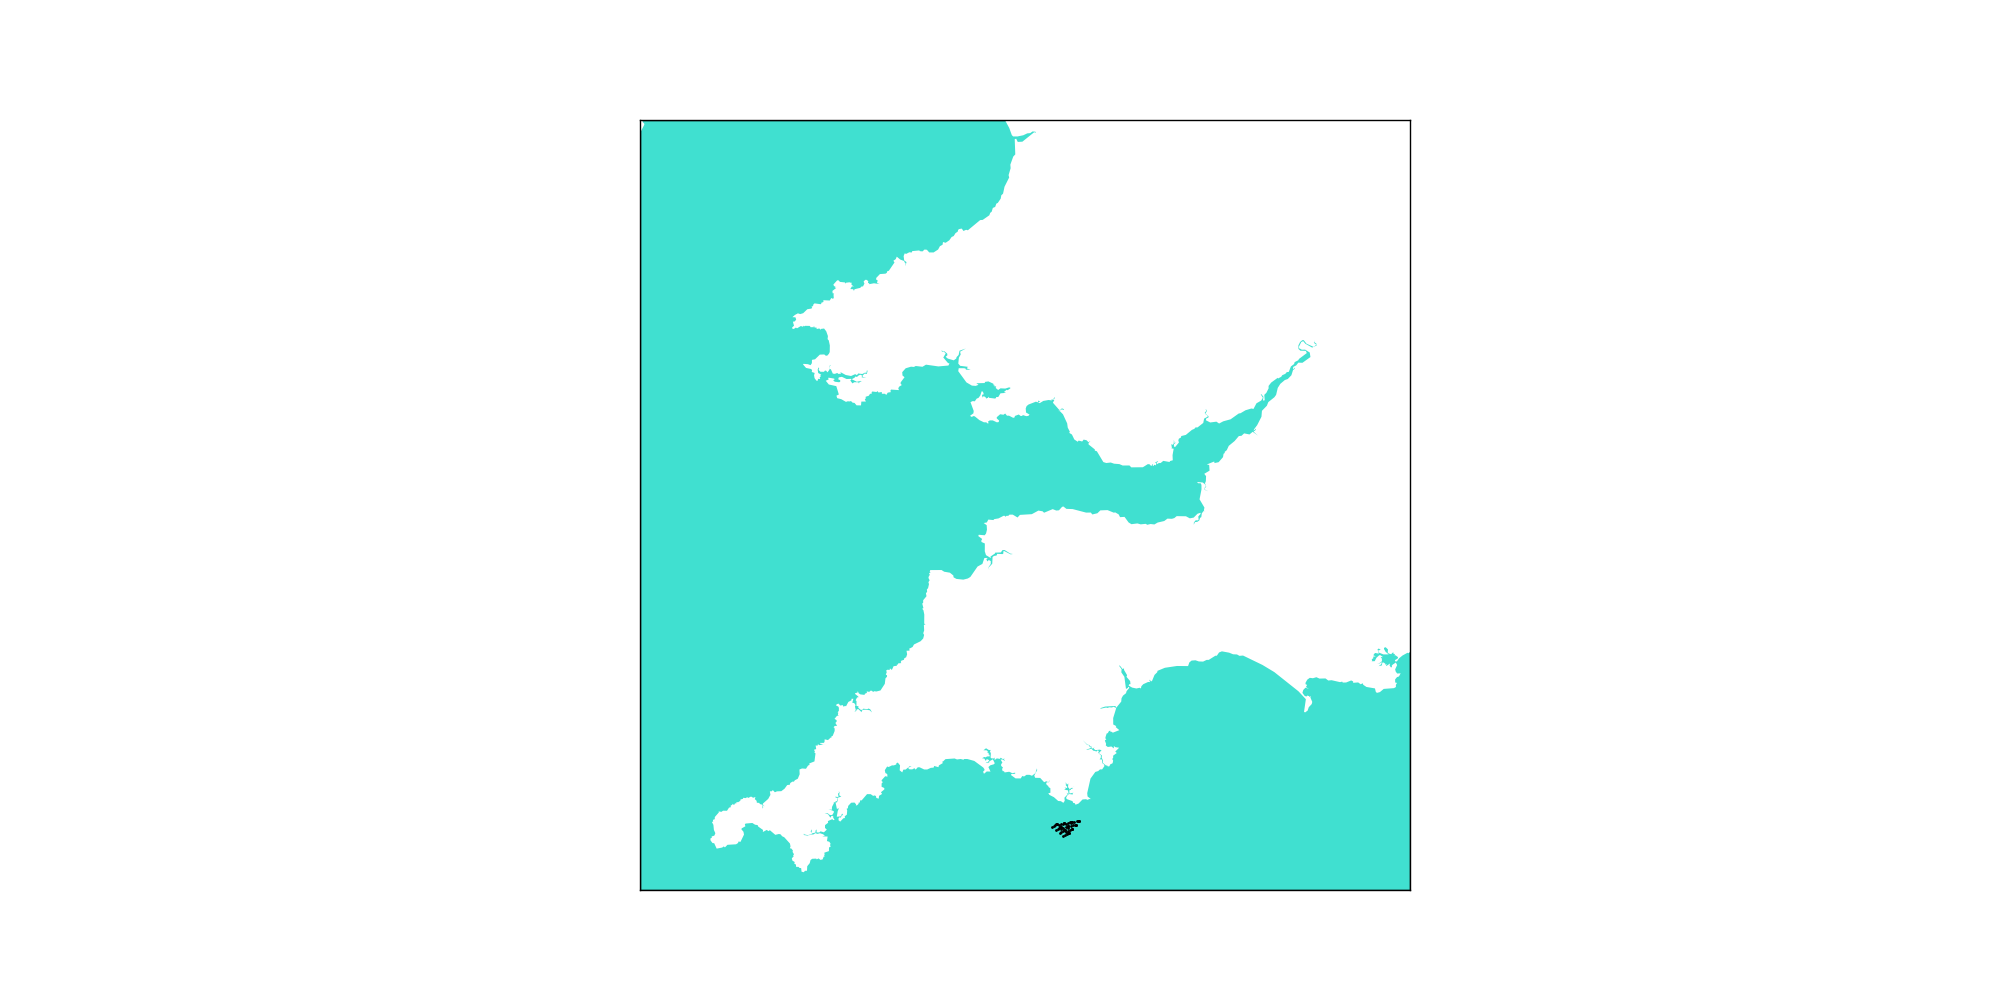
Each image should have 10 points, but the last one is a combination of all maps (so 60 points).
How do I still get 6 maps with only 10 points each?
Edit:
When I use matplotlib.pyplot will not forget previous plots – how can I flush/refresh? I get an error when answering
ValueError: Can not reset the axes. You are probably trying to re-use an artist in more than one Axes which is not supported
When I use answers from How to “clean the slate”?, a similar error pops up
i.e.
plt.clf()
plt.cla()#after plt.show()
Thanks a lot for any help!
Solution
Instead of drawing a new scatterplot for each image, update the data for the scatterplot. The advantage is that the map only needs to be created once, saving some time.
from mpl_toolkits.basemap import Basemap
import matplotlib.pyplot as plt
import numpy as np

Duration = 6 #hours
Xpos1 = np.random.normal(-4, 0.6, size=(Duration,10))
Ypos1 = np.random.normal(51.25, 0.6, size=(Duration,10))

plt.figure(figsize=(20,10))
m = Basemap(width=300000,height=300000,projection='lcc',
        resolution='c',lat_0=51.25,lon_0=-4)
m.drawmapboundary(fill_color='turquoise')
m.fillcontinents(color='white',lake_color='aqua')
m.drawcountries(linestyle='--')

scatter = m.scatter([], [], s=10, c='k', marker='o', label = 'Aurelia aurita', zorder=2)

for i in range (0,Duration):
    x,y = m(Xpos1[i],Ypos1[i])
    scatter.set_offsets(np.c_[x,y])
    plt.savefig('GIF10P%d' %i)

plt.show()