Minimum distance between 2 sets of unequal points… here is a solution to the problem.
Minimum distance between 2 sets of unequal points
I want to be able to find the minimum distance between two sets of points in the xy plane. Suppose the first set of points A has 9 points and the second group of points has 3 points in group B. I want to find the minimum total distance that connects each point in set A to a point in set B. Obviously there will be some overlap, and even some points in set B may not be linked. However, all points in set A must have 1 and only 1 link from it to a point in set B.
If the two collections have the same number of points, I’ve found a way around this problem, here’s the code for it:
import random
import numpy as np
import matplotlib.pyplot as plt
from scipy.spatial.distance import cdist
from scipy.optimize import linear_sum_assignment

points1 = np.array([(x, y) for x in np.linspace(-1,1,3) \
          for y in np.linspace(-1,1,3)])
N = points1.shape[0]
points2 = 2*np.random.rand(N,2)-1

cost12 = cdist(points1, points2)
row_ind12, col_ind12 = linear_sum_assignment(cost12)

plt.plot(points1[:,0], points1[:,1], 'b*')
plt.plot(points2[:,0], points2[:,1], 'rh')
for i in range(N):
    plt.plot([points1[i,0], points2[col_ind12[i],0]], [points1[i,1],
             points2[col_ind12[i],1]], 'k')
plt.show()

Solution
Function scipy.cluster.vq.vq Do what you want.
This is a modified version of your code to demonstrate vq:
import numpy as np
from scipy.cluster.vq import vq
import matplotlib.pyplot as plt

# `points1` is the set A described in the question.
points1 = np.array([(x, y) for x in np.linspace(-1,1,3)
                               for y in np.linspace(-1,1,3)])

# `points2` is the set B.  In this example, there are 5 points in B.
N = 5
np.random.seed(1357924)
points2 = 2*np.random.rand(N, 2) - 1

# For each point in points1, find the closest point in points2:
code, dist = vq(points1, points2)

plt.plot(points1[:,0], points1[:,1], 'b*')
plt.plot(points2[:,0], points2[:,1], 'rh')

for i, j in enumerate(code):
    plt.plot([points1[i,0], points2[j,0]],
             [points1[i,1], points2[j,1]], 'k', alpha=0.4)

plt.grid(True, alpha=0.25)
plt.axis('equal')
plt.show()
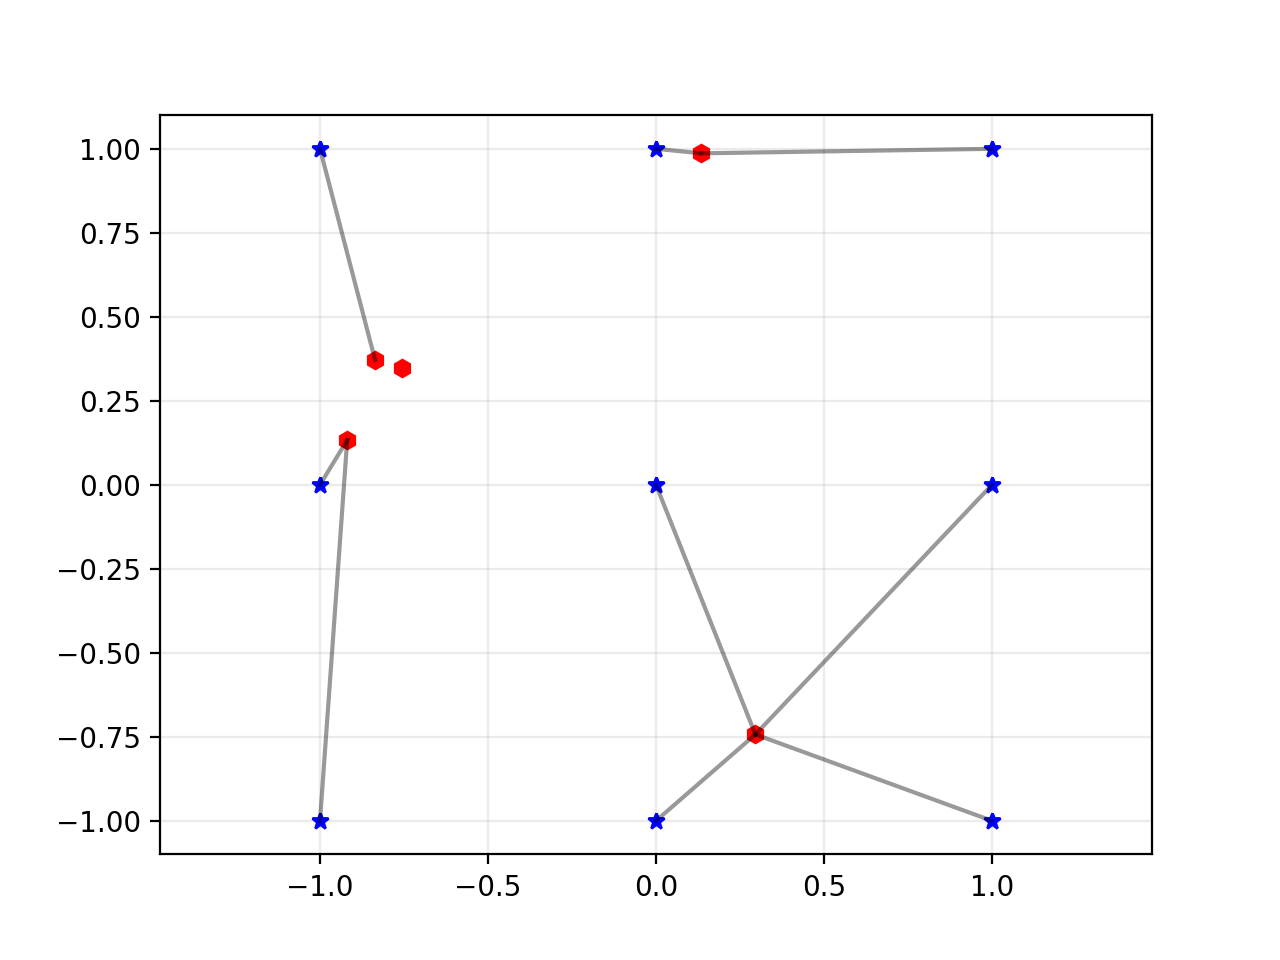
The script produces the following plot: