scipy.optimize.curve_fit does not adapt to the inverted Gauss… here is a solution to the problem.
scipy.optimize.curve_fit does not adapt to the inverted Gauss
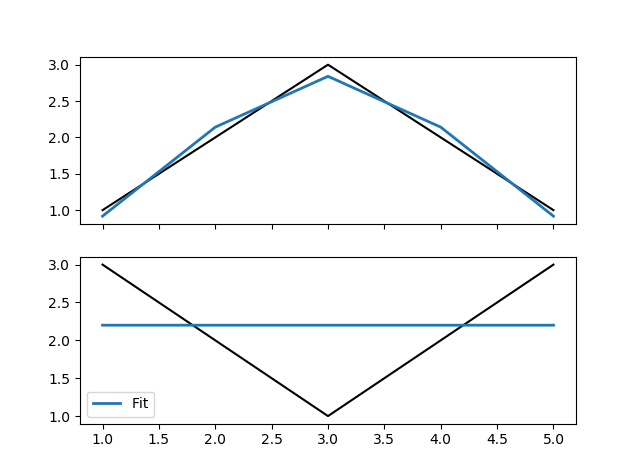
I’m trying to use scipy.optimize.curve_fit to fit a line to an inverted Gaussian distribution. It is well suited to traditional Gaussian distributions, but not for symbolically flipped Gaussian distributions, but always outputs a straight line.
I’ve also tried restricting my Gaussian function so that the variable “a” is always negative, but that didn’t solve the problem. Specifying -max(y) instead of max(y) doesn’t seem to help either.
import scipy
import numpy as np
import matplotlib.pyplot as plt
import statsmodels.api as sm
from scipy import asarray as ar,exp

def fitdata(x, y):
    mean = sum(x * y) / sum(y)
    sigma = np.sqrt(sum(y * (x - mean) ** 2) / sum(y))

def guassianfunc(xVar, a, b, c):
        return a * exp(-(xVar - b) ** 2 / (2 * c ** 2))

popt, _ = scipy.optimize.curve_fit(guassianfunc, x, y, p0=[max(y), mean,         sigma])
    return guassianfunc(np.arange(1, 6, 1), *popt)

x = np.array((1,2,3,4,5))
f, ((ax1, ax2)) = plt.subplots(2, sharex='col', sharey='row')
y = np.array((1, 2, 3, 2, 1))
ax1.plot(x, y, color='black')
ax1.plot(x, fitdata(x, y), linewidth=2, label='Fit')
y = np.array((3, 2, 1, 2, 3))
ax2.plot(x, y, color='black')
ax2.plot(x, fitdata(x, y), linewidth=2, label='Fit')
plt.legend()
Solution
I think this is because your second line may require an offset parameter? That is, your guassianfunc can make an inverted bell curve, provided it is below the x-axis. For example:
y = np.array((3, 2, 1, 2, 3))-4
ax2.plot(x, y, color='black')
ax2.plot(x, fitdata(x, y), linewidth=2, label='Fit')
Try adding the 4th parameter like this
def fitdata(x, y):
    mean = sum(x * y) / sum(y)
    sigma = np.sqrt(sum(y * (x - mean) ** 2) / sum(y))

def guassianfunc(xVar, a, b, c, d):
        return a * exp(-(xVar - b) ** 2 / (2 * c ** 2)) + d

popt, _ = scipy.optimize.curve_fit(guassianfunc, x, y, p0=[max(y), mean,         sigma,0])
    return guassianfunc(x, *popt)
This also greatly reduces your errors.