The best-fit line for scatter plots
If I don’t know the relationship between the 2 axes (otherwise I can use scipy.optimize), is there any way to find the best fitted line for the scatterplot. My scatterplot looks like this
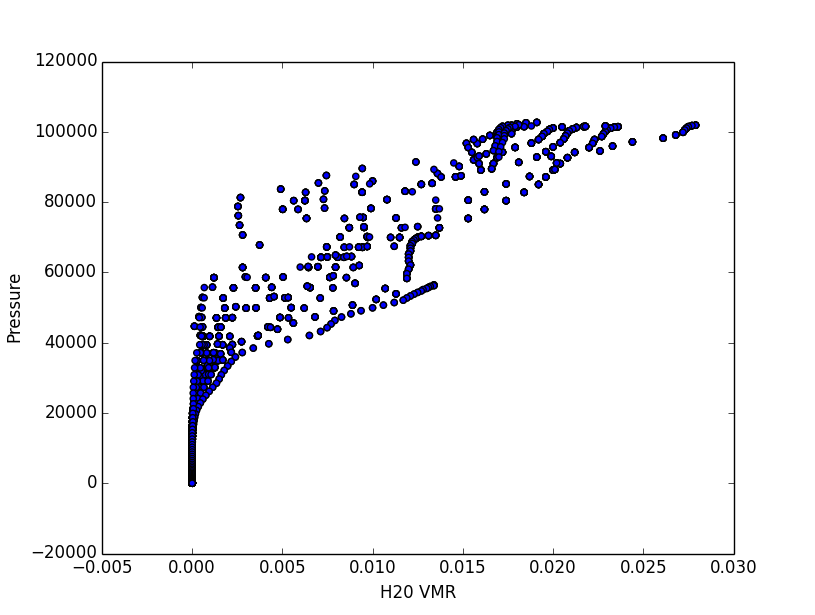
I want a line like this
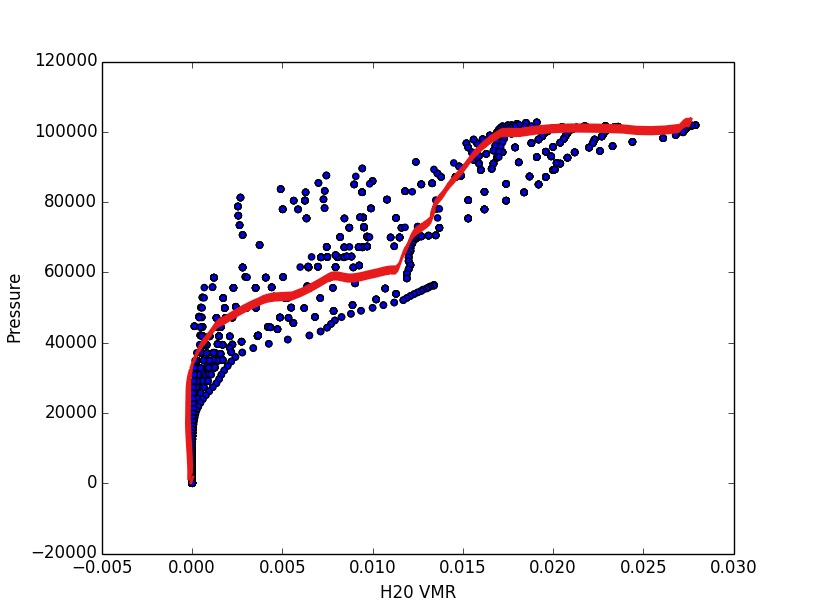
I need the point with the best fitted line for further calculations
for j in lat :
l=94*j
i=l-92
for lines in itertools.islice(input_file, i, l):
    lines=lines.split()
    p.append(float(Decimal(lines[0])))
    vmr.append(float(Decimal(lines[3])))
    plt.scatter(vmr, p)
Solution
You can use LOWESS (Locally Weighted Scatterplot Smoothing), a nonparametric regression method.
Statsmodels has an implementation here You can use it to adapt to your own smoother.
Check out this StackOverflow question on visualizing nonlinear relationships in scatter plots, for example, using Statsmodels.
You can also use the implementation with the keyword parameter lowess=True in the regplot() function of the Seaborn visualization library. See Seaborn documentation for details.
The following code is an example of using data from Seaborn and the StackOverflow question above:
import numpy as np
import seaborn as sns
sns.set_style("white")

x = np.arange(0,10,0.01)
ytrue = np.exp(-x/5.0) + 2*np.sin(x/3.0)

# add random errors with a normal distribution
y = ytrue + np.random.normal(size=len(x))

sns.regplot(x, y, lowess=True, color="black",
            line_kws={"color":"magenta", "linewidth":5})
