The polar graph problem in Python without taking angles into account
I’m having some issues working with polar plots. The graph I should get is a figure-eight (some of my friends plot the data in Origin and Excel and it does work), but it looks like the code isn’t written well. By looking at the graph, I see that the code doesn’t take into account the angles (theta arrays) I’m writing, but I don’t know why that’s the case. I’ve tried more code and written angular in radians, but nothing seems to work.
import numpy as np
import matplotlib.pyplot as plt
from pylab import *
import matplotlib.pyplot as plt
from pylab import *
import numpy as np

r = np.array([11.7,12.1,10.1,6.6,3.1,1.5,2.3,5.2,
8.7,11.5,12,10.1,6.6,3.3,1.5,2.3,5.3,9.2,11.9])

theta =np.array([0,20,40,60,80,100,120,140,160,180,
200,220,240,260,280,300,320,340,360])

ax = plt.subplot(111, projection='polar')
ax.plot(theta,r)
ax.set_rmax(13)
ax.set_rticks([2,4,6,8,10,12])  # less radial ticks
ax.set_rlabel_position(-40)  # get radial labels away from plotted line
ax.grid(True)

ax.set_title("A line plot on a polar axis", va='bottom')
plt.show()
I’ve tried this too:
r3 = np.array([11.7,12.1,10.1,6.6,3.1,1.5,2.3,5.2,
8.7,11.5,12,10.1,6.6,3.3,1.5,2.3,5.3,9.2,11.9])

theta3 =np.array([0,20,40,60,80,100,120,140,160,180,
200,220,240,260,280,300,320,340,360])

fig = plt.figure()
ax = fig.add_subplot(111, projection='polar')
c = ax.scatter(theta3, r3)
Solution
Counterintuitively, while a polar plot shows its theta axis in degrees, it actually expects coordinates to be measured in radians:
import numpy as np
import matplotlib.pyplot as plt

r = np.array([11.7,12.1,10.1,6.6,3.1,1.5,2.3,5.2,
              8.7,11.5,12,10.1,6.6,3.3,1.5,2.3,5.3,9.2,11.9])

theta =np.array([0,20,40,60,80,100,120,140,160,180,
                 200,220,240,260,280,300,320,340,360], dtype=float) # making sure it is float
# convert to radians
# theta *= np.pi/180.
theta = np.deg2rad(theta)

ax = plt.subplot(111, projection='polar')
ax.plot(theta,r)
ax.grid(True)

ax.set_title("A line plot on a polar axis", va='bottom')
plt.show()
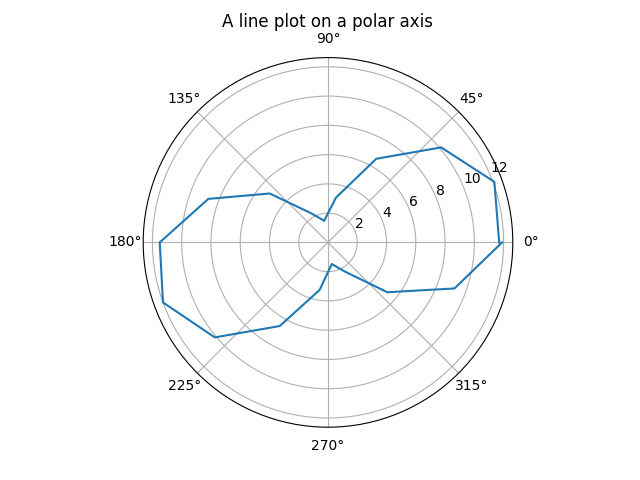
I didn’t manage to find anywhere in the documentation that explicitly states this (only examples done correctly).
The strange picture you get comes from the fact that all values above 2pi fold back into the range of 0…2pi. So for example, 20 % 2pi = 1.15, which is about 65 degrees after conversion, which is the actual position of the second value in your plot.