Use Pandas to plot datetimes… here is a solution to the problem.
Use Pandas to plot datetimes
I
have a python program where I read a csv file onto a Pandas dataframe. Then I want to plot my sensor values with datetime in a clean format. My code gives error ValueError: time data ‘2017/02/17’ does not match format ‘%Y/%m/%d %H:%M:%S.%f.
Some lines in my code and data frame are as follows:
Code:
import pandas as pd
    from datetime import datetime
    import csv
    import matplotlib.pyplot as plt
    import matplotlib.dates as mdates
    headers = ['Sensor Value','Date','Time']
    df = pd.read_csv('C:/Users\Lala Rushan\Downloads\DataLog.CSV', parse_dates= {'Datetime': [1,2]},names=headers)

print (df)

df['Datetime'] = df['Datetime'].map(lambda x: datetime.strptime(str(x), "%y/%m/%d , %H:%M:%S.%f"))
    #datetime.strptime(df['Datetime'],"%Y/%m/%d %H:%M:%S.%f")
    x = df['Datetime']
    y = df['Sensor Value']

# plot
    plt.plot(x,y)
    # beautify the x-labels
    plt.gcf().autofmt_xdate()

plt.show()
Data frame:
                      Datetime  Sensor Value
0     2017/02/17  19:06:17.188             2
1     2017/02/17  19:06:22.360            72
2     2017/02/17  19:06:27.348            72
3     2017/02/17  19:06:32.482            72
4     2017/02/17  19:06:37.515            74
5     2017/02/17  19:06:42.580            70
6     2017/02/17  19:06:47.660            72
How do I fix this error? I’m new to python, so please forgive any basic errors.
Solution
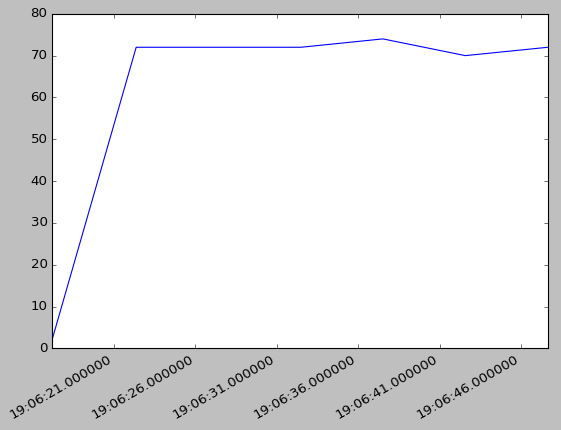
You don’t need to split the date and time. The code below works fine for me.
import pandas as pd
from datetime import datetime
import csv
import matplotlib.pyplot as plt

df = pd.read_csv('test.txt')
print (df)

df['Datetime'] = df['Datetime'].map(lambda x: datetime.strptime(str(x), "%Y/%m/%d %H:%M:%S.%f"))

x = df['Datetime']
y = df['Sensor Value']

# plot
plt.plot(x,y)

# beautify the x-labels
plt.gcf().autofmt_xdate()
plt.show()