xytext details in Matplotlibs comments
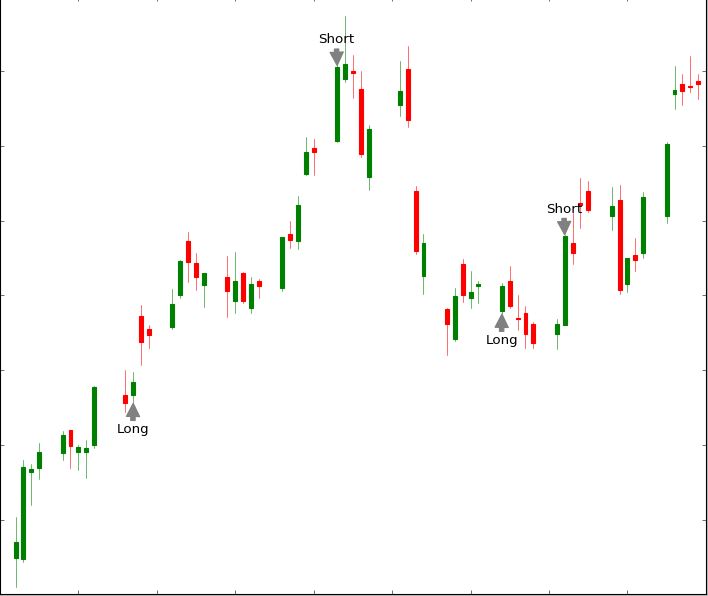
I draw a candlestick chart using the following code and use annotations. I kept playing around until I found the correct position of the text, but I still don’t understand that the numbers xytext=(-15, -27) and xytext=(-17, 20) are related to their current location.
This is weird to me. Can someone explain this to me? Thank you very much!
This is what my chart looks like, here’s the code:
import matplotlib.pyplot as plt
import matplotlib.dates as mdates
from matplotlib.finance import candlestick_ohlc
from matplotlib import style
import pandas_datareader
import datetime as dt

style.use('classic')
start = dt.datetime(2017,1,1)
end = dt.datetime(2017,4,1)

def graph(stock):
    ax1 = plt.subplot2grid((1,1), (0,0))
    stock_data = pandas_datareader. DataReader(name=stock, data_source='google', start=start, end=end)
    stock_data.reset_index(inplace=True)
    stock_data['Date'] = stock_data['Date'].map(mdates.date2num)
    candlestick_ohlc(ax1, stock_data.values, width=0.5, colorup='g', colordown='r')

ax1.annotate('Long',
                 xy=(stock_data['Date'][10], stock_data['Low'][10]),
                 xytext=(-15, -27),
                 textcoords='offset points',
                 arrowprops=dict(facecolor='grey', color='grey'))

ax1.annotate('Short',
                 xy=(stock_data['Date'][28], stock_data['High'][28]),
                 xytext=(-17, 20),
                 textcoords='offset points',
                 arrowprops=dict(facecolor='grey', color='grey'))

ax1.annotate('Long',
                 xy=(stock_data['Date'][42], stock_data['Low'][42]),
                 xytext=(-15, -27),
                 textcoords='offset points',
                 arrowprops=dict(facecolor='grey', color='grey'))

ax1.annotate('Short',
                 xy=(stock_data['Date'][48], stock_data['High'][48]),
                 xytext=(-17, 20),
                 textcoords='offset points',
                 arrowprops=dict(facecolor='grey', color='grey'))

plt.show()

graph('TSLA')
Solution
You choose to set the text coordinates in the offset point. For example. xytext=(-17, 20) Place the text to the left of the 17 points, and the 20 points start from the point you commented.
The coordinates may be more obvious when changing horizontalalignment in annotations to “center". Comment ( ... , ha="center").
You can then get the result by setting the x-coordinate to 0.
ax1.annotate('Long', xy=(stock_data['Date'][10], stock_data['Low'][10]),
                 xytext=(0, -27),
                 textcoords='offset points', ha="center",
                 arrowprops=dict(facecolor='grey', color='grey'))