Calculate consistency in python
I’m learning about cross-spectrum and coherence. As I understand it, coherence is similar to correlation because you can normalize the cross-spectrum by the product of the individual power spectra:

This is my current python implementation
import numpy

def crossSpectrum(x,y):

#-------------------Remove mean-------------------
    xp=x-numpy.mean(x)
    yp=y-numpy.mean(y)
    n=len(x)

# Do FFT
    cfx=numpy.fft.fft(xp)/n
    cfy=numpy.fft.fft(yp)/n
    freq=numpy.fft.fftfreq(n)

# Get cross spectrum
    cross=cfx.conj()*cfy

return cross,freq

#-------------Main---------------------------------
if __name__=='__main__':

x=numpy.linspace(-250,250,500)
    noise=numpy.random.random(len(x))
    y=10*numpy.sin(2*numpy.pi*x/10.) +5*numpy.sin(2*numpy.pi*x/5.) +\
            2*numpy.sin(2*numpy.pi*x/20.) +10
    y+=noise*10
    y2=5*numpy.sin(2*numpy.pi*x/10.) +5+noise*50

p11,freq=crossSpectrum(y,y)
    p22,freq=crossSpectrum(y2,y2)
    p12,freq=crossSpectrum(y,y2)

# coherence
    coh=numpy.abs(p12)**2/p11.real/p22.real
    print coh
The coherence I calculated is an array of 1. What am I doing wrong?
In addition, sometimes coherent graphs have downward-pointing spikes (e.g. output from scipy.signal.coherence), and elsewhere pointing upwards (e.g. here)。 I’m a little confused by the explanation of coherence, shouldn’t greater coherence mean covariance between 2 time series at that frequency?
Thanks in advance.
Solution
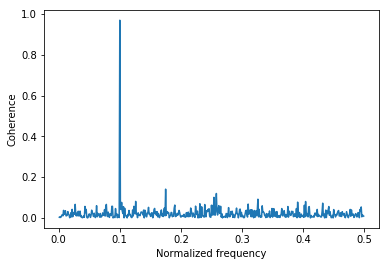
You should be using the Welch method all the time. As an example, attach code that is similar to your code (with some simplification) and has the expected result.
import numpy
from matplotlib.pyplot import plot, show, figure, ylim, xlabel, ylabel
def crossSpectrum(x, y, nperseg=1000):

#-------------------Remove mean-------------------
cross = numpy.zeros(nperseg, dtype='complex128')
for ind in range(x.size / nperseg):

xp = x[ind * nperseg: (ind + 1)*nperseg]
    yp = y[ind * nperseg: (ind + 1)*nperseg]
    xp = xp - numpy.mean(xp)
    yp = yp - numpy.mean(xp)

# Do FFT
    cfx = numpy.fft.fft(xp)
    cfy = numpy.fft.fft(yp)

# Get cross spectrum
    cross += cfx.conj()*cfy
freq=numpy.fft.fftfreq(nperseg)
return cross,freq

#-------------Main---------------------------------
if __name__=='__main__':

x=numpy.linspace(-2500,2500,50000)
noise=numpy.random.random(len(x))
y=10*numpy.sin(2*numpy.pi*x)
y2=5*numpy.sin(2*numpy.pi*x)+5+noise*50

p11,freq=crossSpectrum(y,y)
p22,freq=crossSpectrum(y2,y2)
p12,freq=crossSpectrum(y,y2)

# coherence
coh=numpy.abs(p12)**2/p11.real/p22.real
plot(freq[freq > 0], coh[freq > 0])
xlabel('Normalized frequency')
ylabel('Coherence')
and visualization