Given a picture, create the plot as accurately as you can… here is a solution to the problem.
Given a picture, create the plot as accurately as you can
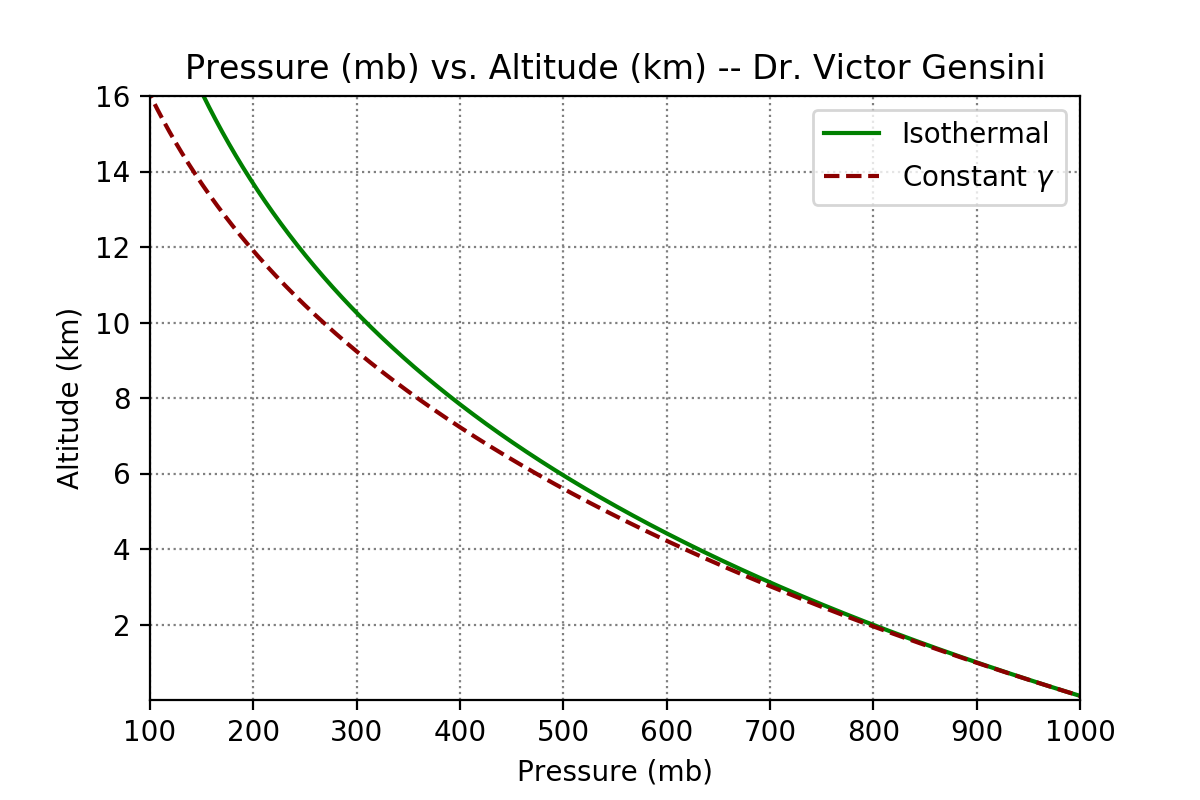
I’m trying to chart and it looks a bit exponentially down (see graph), but I can’t seem to get it to work….
import numpy as np
import matplotlib.pyplot as plt

p0 = 1013.
Rd = 0.2871
g = 0.00981
T = T0 = 288.
y = 0.000006
H = (Rd*T)/g
z = np.arange(0.,1600.,)
yz = y*z
yR = y*Rd

p1 = (p0)*(np.exp(-z/H))

p2 = (p0)*(((T-yz)/T)**(g/yR))

plt.plot(p1,z,'g-')
plt.plot(p2,z,'r--')

plt.legend(['Isothermal', 'Constant γ'])
plt.title('Pressure (mb) vs. Altitude (km) --  Brandi Slavich')
plt.xlabel("Pressure (mb)")
plt.ylabel('Altitude (km)')
plt.grid(linestyle='--')
plt.axis([100.,1000.,0.,16.])
plt.show()

TypeError: only length-1 arrays can be converted to Python scalars
---> p1 = (p0)*(exp(-z/H))
Target image:
Solution
The error comes from exp(-z/h). To avoid this, you can use np.exp instead.
It looks like math.exp can only handle numpy.ndarray with scalar or shape (1, ).
import numpy as np
import math

math.exp(np.array([100]))
# 2.6881171418161356e+43

math.exp(np.array([100, 200]))
# Traceback (most recent call last):
#   File "<stdin>", line 1, in <module>
# TypeError: only length-1 arrays can be converted to Python scalars

np.exp(np.array([100, 200]))
# array([  2.68811714e+43,   7.22597377e+86])
Add:
Also, I think it’s good that the axis range of your plot [100.,1000.,0.,16.] doesn’t fit your data range (z, p1, p2).
# y-axis: 0 - 16
# >>> (z.min(), z.max())
# (0.0, 1599.0)

# x-axis: 100 - 1000
# >>> (p1.min(), p1.max())
# (837.95200017838602, 1013.0)
# >>> (p2.min(), p2.max())
# (835.24824032186791, 1013.0)