Matplotlib legend unicode tag
I’m trying to put a specific unicode tag entry in the legend list of matplotlib.
I want a symbol that looks like this: |—| (a continuous line, maybe not that tall pipe) in order to put this annotation in the legend list:
ax.annotate('', xy=(0, 1), xytext=(5, 1), arrowprops={'arrowstyle':'|-|'})
What I tried:
ax.scatter([], [], c='red', marker="$|---|$", s=120, label='my marker')
This works, but the spacing between each character looks a bit bad. I found this looks a bit like the unicode characters I wanted. Anyone know which looks better? I want a combination of long left tack and long right tack, but it is not known whether it exists.
How do I use Unicode as a legend entry? I tried :
ax.scatter([], [], c='red', marker=u"$\U0001D129$", s=120, label='my marker')
Solution
It seems that using unicode symbols is just a workaround to place the actual annotation arrows in the legend. This can be achieved by using a custom legend handler. You can do this by subclassing the legend handler for the line and placing an annotation arrow in it. Then call what it looks like
annotate = ax.annotate(..., label="marker")
ax.legend(handles = [annotate],
          handler_map={type(annotate) : AnnotationHandler(5)})
Here 5 is the mutation scale, which indicates the length of the vertical line in the arrow.
import numpy as np
import matplotlib.pyplot as plt
from matplotlib.legend_handler import HandlerLine2D
from matplotlib.patches import FancyArrowPatch
class AnnotationHandler(HandlerLine2D):
def __init__(self,ms,*args,**kwargs):
self.ms = ms
HandlerLine2D.__init__(self,*args,**kwargs)
def create_artists(self, legend, orig_handle,
xdescent, ydescent, width, height, fontsize,
trans):
xdata, xdata_marker = self.get_xdata(legend, xdescent, ydescent,
width, height, fontsize)
ydata = ((height - ydescent) / 2.) * np.ones(xdata.shape, float)
legline = FancyArrowPatch(posA=(xdata[0],ydata[0]),
posB=(xdata[-1],ydata[-1]),
mutation_scale=self.ms,
**orig_handle.arrowprops)
legline.set_transform(trans)
return legline,
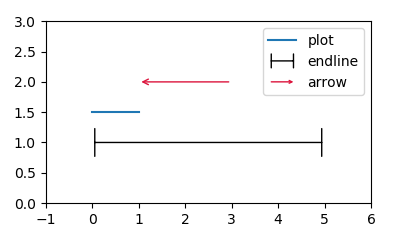
fig, ax = plt.subplots()
ax.axis([-1,6,0,3])
ax.plot([1.5,1.5], label="plot")
# create annotations in the axes
annotate = ax.annotate('', xy=(0, 1), xytext=(5, 1),
arrowprops={'arrowstyle':'|-|'}, label="endline")
annotate2 = ax.annotate('', xy=(1, 2), xytext=(3, 2),
arrowprops=dict(arrowstyle='->',color="crimson"), label="arrow")
# create legend for annotations
h, l = ax.get_legend_handles_labels()
ax.legend(handles = h +[annotate,annotate2],
handler_map={type(annotate) : AnnotationHandler(5)})
plt.show()