Surface_plot : Add legend to facecolors… here is a solution to the problem.
Surface_plot : Add legend to facecolors
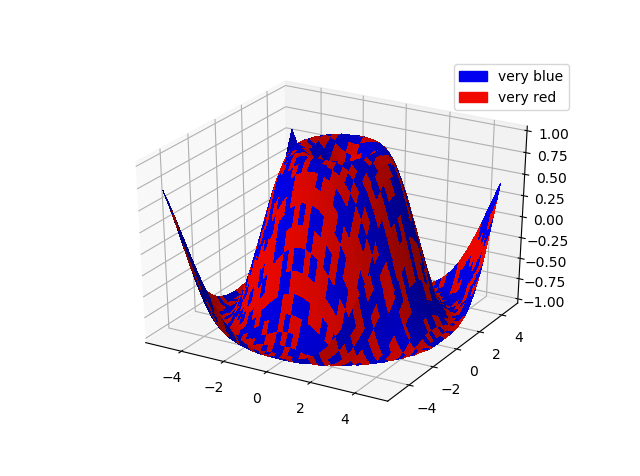
Let’s say I’m drawing something with two different surface colors as shown below, with the colors red and blue. I want to add two items to the legend with a custom string and a color for each color in my collection.
What should I do?
# generate the plot
from mpl_toolkits.mplot3d import Axes3D
from matplotlib import cm
from matplotlib.ticker import LinearLocator, FormatStrFormatter
import matplotlib.pyplot as plt
import numpy as np
from numpy import random
fig = plt.figure()
ax = fig.add_subplot(111, projection='3d')
X = np.arange(-5, 5, 0.25)
Y = np.arange(-5, 5, 0.25)
X, Y = np.meshgrid(X, Y)
R = np.sqrt(X**2 + Y**2)
Z = np.sin(R)
col1, col2 = cm.jet(np.array([0.1, 0.9]))
my_choice = random.choice([0, 1], size=X.shape)
my_color = my_choice[..., None] * col1[None, None, :] + (1 - my_choice)[..., None] * col2[None, None, :]
surf = ax.plot_surface(X, Y, Z, rstride=1, cstride=1, facecolors = my_color,
        linewidth=0, antialiased=False)
ax.set_zlim(-1.01, 1.01)
# customstrings for legend:
myLegendLabels = {0: 'very red', 1: 'very blue'}
Solution
You can use “Proxy artists” do this:
from mpl_toolkits.mplot3d import Axes3D
from matplotlib import cm
from matplotlib.ticker import LinearLocator, FormatStrFormatter
import matplotlib.pyplot as plt
import matplotlib.patches as mpatches
import numpy as np
from numpy import random

# generate the plot
fig = plt.figure()
ax = fig.add_subplot(111, projection='3d')
X = np.arange(-5, 5, 0.25)
Y = np.arange(-5, 5, 0.25)
X, Y = np.meshgrid(X, Y)
R = np.sqrt(X**2 + Y**2)
Z = np.sin(R)
col1, col2 = cm.jet(np.array([0.1, 0.9]))
my_choice = random.choice([0, 1], size=X.shape)
my_color = my_choice[..., None] * col1[None, None, :] + (1 - my_choice)[..., None] * col2[None, None, :]
surf = ax.plot_surface(X, Y, Z, rstride=1, cstride=1, facecolors = my_color,
        linewidth=0, antialiased=False)
ax.set_zlim(-1.01, 1.01)
# Add legend with proxy artists
col1_patch = mpatches. Patch(color=col1, label='very blue')
col2_patch = mpatches. Patch(color=col2, label='very red')
plt.legend(handles=[col1_patch, col2_patch])
Result: